Get the Latest in Your Inbox
Want to stay up to date on the state of the world’s forests? Subscribe to our mailing list.
Subscribe
How much production forest exists globally?
An estimated 1.15 billion hectares (Bha) of forest are designated primarily for production, equivalent to roughly 30 percent of global forest area.FAO 2020, http://www.fao.org/3/ca9825en/CA9825EN.pdf . This 2020 estimate reflects a slight decrease of about 50 Mha since 2015.FAO 2016, http://www.fao.org/3/a-i4793e.pdf . Although most production forests are natural forests, planted forests and tree plantations increased in area by 75 percent (167–290 Mha) between 1990 and 2020 and are expected to play a growing role in meeting rising global demand for wood products.FAO 2020, http://www.fao.org/3/ca9825en/CA9825EN.pdf . As of 2020, planted forests and tree plantations account for 7 percent of global forest area (up from 4 percent in 1990).FAO Forestry database, http://www.fao.org/forestry/en/ . These estimates are published by the FAO and based on national-scale statistical data rather than geospatial data.
More
Where are the world’s production forests?
No publicly available and globally comprehensive map of production forests currently exists. The available map approximates the location of production forests based on a model that identifies areas in which large-scale forestry operations are the dominant cause of tree cover loss .Curtis et. al. 2018, https://science.sciencemag.org/content/361/6407/1108/tab-figures-data . Production forests appear extensively in the temperate and boreal forests of North America, Europe, Russia, China, southern Brazil, Chile, South Africa, and Australia. The model largely fails to identify production forests known to exist in the tropics for reasons described below.
More
Current Models of Production Forests
Forest areas in which large-scale wood harvesting operations are the dominant cause of tree cover loss
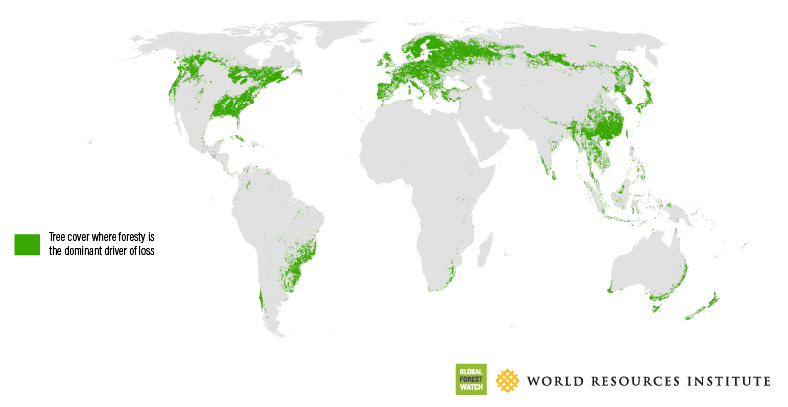
The model used to create this map analyzes 30-by-30-meter (m) pixel tree cover change dataBased on the Hansen et al. (2013) Global Forest Change data set, https://earthenginepartners.appspot.com/science-2013-global-forest/download_v1.7.html . and other data inputs to identify the dominant driver of tree cover loss within a 10-by-10-kilometer (km) grid cell. Cyclical patterns of tree cover loss and gain in the same grid cell are considered a likely indicator of forestry activities, in which wood harvesting is followed by forest regeneration and/or tree planting. Due to the spatial resolution of the model and underlying tree cover change data,The model identifies the dominant driver of tree cover loss within a 10-by-10 km grid cell, interpreted from underlying tree cover change data at 30-by-30 m resolution. the map is most likely to capture tree cover in which industrial roundwood is being harvested at large scales, whether through rotational harvesting of plantations, stand-level clear-cuts of natural or seminatural forests, or mechanized selective logging. Nonindustrial or highly selective forms of harvesting are less likely to be visible within 30-meter resolution Landsat satellite imagery and are therefore less likely to be reflected in the model results. Nonindustrial and selective harvesting can include collecting fuelwood for subsistence purposes, some forms of thinning to reduce fire risk, and highly selective felling of individual trees (e.g., canoe trees) where the surrounding forest is left intact.
Read More +
More
A better understanding of the location of production forests in the tropics can be gained by compiling managed forest concession maps, although such maps are often difficult to obtain and are not consistently updated. These maps show where governments have given rights to private companies to harvest timber and other wood products from natural forests on public lands. Global Forest Watch (GFW) has compiled and published managed forest concession maps for nine countries.Logging concession data compiled and published by GFW. In these nine countries, managed forest concessions cover 26 percent of the total forest area, including 13 percent of intact forest landscapes. Although these concession data are far from globally comprehensive and the existence of a concession does not always imply active logging, the data suggest that natural forests, including intact forests, continue to be important sources of wood in the tropics as well as in boreal forests in countries such as Canada and Russia.
More
Locations of logging concessions in nine countries<fn>Logging concession data compiled and published by GFW.</fn>
More
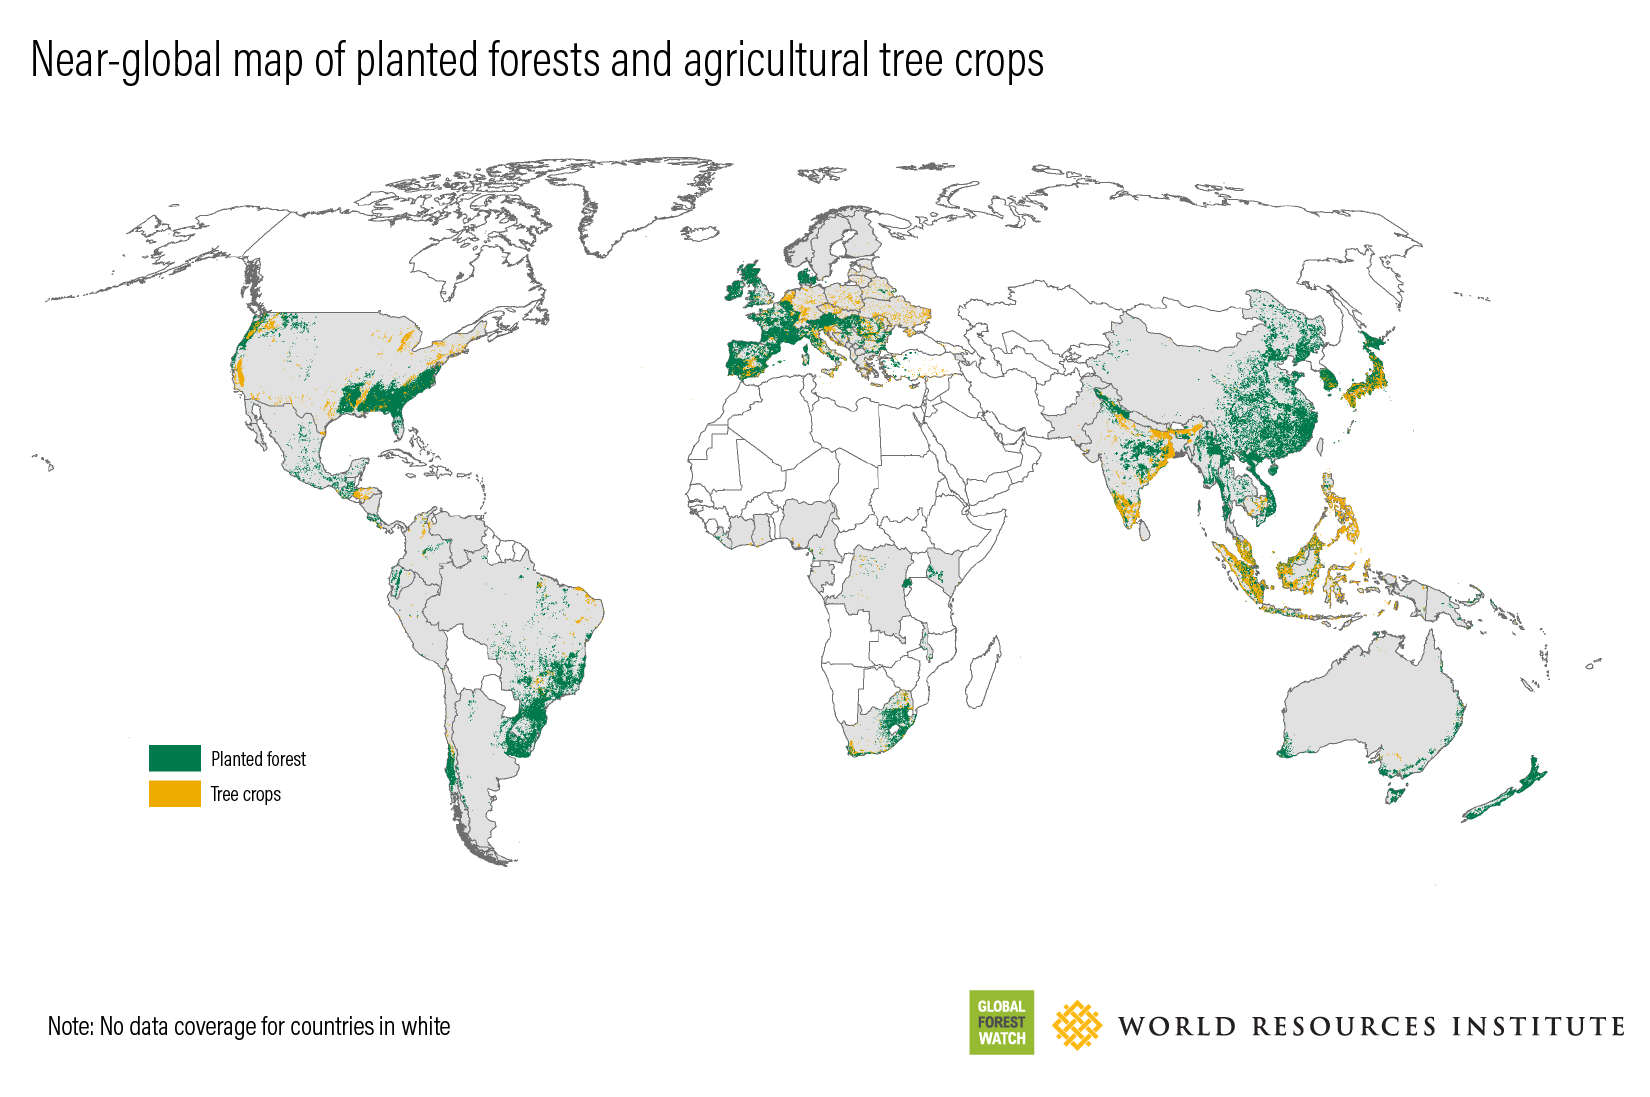
Where are the world’s tree plantations?
Intensively managed tree plantations are typically not considered a “forest” due to their limited species composition and row-like spacing, but they play a critical role in meeting global demand for wood products. A 2018 studyHarris et al. 2019, https://www.wri.org/publication/planted-trees . aggregates maps of tree plantations from a variety of sources and time periods; the maps are estimated to capture roughly 75 percent (173 Mha) of tree plantations worldwide. Based on this map, four countries account for half of all tree plantation area: the United States, Brazil, China, and Japan. Other than Japan, these countries are among the world’s top five producers of industrial roundwood. Key roundwood-producing countries that are missing from this data set include Canada and Russia (ranked second and third, respectively, for industrial roundwood production globally), which rely more on natural and seminatural forests for wood production rather than intensively managed tree plantations.
More
Commercial tree plantations are concentrated in a small number of countries
More
Limitations and Future Prospects
Comprehensive and complete data showing the location of production forests worldwide are currently lacking. Without such data, it is difficult to systematically assess the extent to which such forests are being managed sustainably and the changing condition and capacity of these forests to provide essential wood products.
Mapping forest areas in which large-scale forestry operations have been classified by a model as the dominant cause of tree cover loss provides one way to approximate the location of production forests. However, this approach likely misses forests in which selective logging is the main form of wood harvesting due to the relatively coarse resolution of the model (10-by-10 km) and underlying satellite data (30-by-30 m). Efforts to use higher-resolution satellite imagery to detect tree cover change and refine driver classification models—both of which are currently under way—may allow for better approximation of production forest locations in the near future.
Public disclosure of logging concession data in countries where most production forests are publicly owned and boundary data for privately held production forests could also help fill this data gap. Forest managers and national and subnational forest agencies often hold a wealth of geospatial data on production forests, including boundaries, growing stock, species distribution, and harvest volumes, but these data tend to be highly tailored to the local context and are often not open to the public. Even if such data were to become publicly available, collecting and consolidating disparate data sets into a consistent and regularly updated global map remains a significant challenge.
More
Many Forest Products Are Not Captured in Official Statistics
Forests provide a wealth of timber and nontimber forest products to rural communities, most of which are not reflected in official statistics on forest production and are impossible to map at scale. As such, the forests that provide these benefits to local communities are unlikely to be captured in the maps of production forests featured in this indicator. Forest fuelwood, for example, makes up roughly half of global wood removalsFAO 2016, http://www.fao.org/3/a-i4793e.pdf . and 40 percent of global renewable energy—as much as solar, hydroelectric, and wind power combined.FAO 2018. http://www.fao.org/3/i9535en/i9535en.pdf . As forest degradation and deforestation spread, communities have to walk longer and farther to obtain wood for heating homes and cooking food. Other important nontimber forest products include fruits and nuts, vegetables, fish and game, medicinal plants, resins, and natural fibers such as rattan.
Read More +
More
{"Glossary":{"51":{"name":"agricultural tree crops","description":"Trees cultivated for their food, cultural, or economic values. These include oil palm, rubber, cocoa, cashew, mango, oranges (citrus), plantain, banana, and coconut.\r\n"},"141":{"name":"agroforestry","description":"A diversified set of agricultural or agropastoral production systems that integrate trees in the agricultural landscape.\r\n"},"101":{"name":"albedo","description":"The ability of surfaces to reflect sunlight.\u0026nbsp;Light-colored surfaces return a large part of the sunrays back to the atmosphere (high albedo). Dark surfaces absorb the rays from the sun (low albedo).\r\n"},"94":{"name":"biodiversity intactness","description":"The proportion and abundance of a location\u0027s original forest community (number of species and individuals) that remain.\u0026nbsp;\r\n"},"95":{"name":"biodiversity significance","description":"The importance of an area for the persistence of forest-dependent species based on range rarity.\r\n"},"142":{"name":"boundary plantings","description":"Trees planted along boundaries or property lines to mark them well.\r\n"},"98":{"name":"carbon dioxide equivalent (CO2e)","description":"Carbon dioxide equivalent (CO2e) is a measure used to aggregate emissions from various greenhouse gases (GHGs) on the basis of their 100-year global warming potentials by equating non-CO2 GHGs to the equivalent amount of CO2.\r\n"},"99":{"name":"CO2e","description":"Carbon dioxide equivalent (CO2e) is a measure used to aggregate emissions from various greenhouse gases (GHGs) on the basis of their 100-year global warming potentials by equating non-CO2 GHGs to the equivalent amount of CO2.\r\n"},"1":{"name":"deforestation","description":"The change from forest to another land cover or land use, such as forest to plantation or forest to urban area.\r\n"},"77":{"name":"deforested","description":"The change from forest to another land cover or land use, such as forest to plantation or forest to urban area.\r\n"},"76":{"name":"degradation","description":"The reduction in a forest\u2019s ability to perform ecosystem services, such as carbon storage and water regulation, due to natural and anthropogenic changes.\r\n"},"75":{"name":"degraded","description":"The reduction in a forest\u2019s ability to perform ecosystem services, such as carbon storage and water regulation, due to natural and anthropogenic changes.\r\n"},"79":{"name":"disturbances","description":"A discrete event that changes the structure of a forest ecosystem.\r\n"},"68":{"name":"disturbed","description":"A discrete event that changes the structure of a forest ecosystem.\r\n"},"65":{"name":"driver of tree cover loss","description":"The direct cause of forest disturbance.\r\n"},"70":{"name":"drivers of loss","description":"The direct cause of forest disturbance.\r\n"},"81":{"name":"drivers of tree cover loss","description":"The direct cause of forest disturbance.\r\n"},"102":{"name":"evapotranspiration","description":"When solar energy hitting a forest converts liquid water into water vapor (carrying energy as latent heat) through evaporation and transpiration.\r\n"},"2":{"name":"forest","description":"Forests include tree cover greater than 30 percent tree canopy density and greater than 5 meters in height as mapped at a 30-meter Landsat pixel scale.\r\n"},"3":{"name":"forest concession","description":"A legal agreement allowing an entity the right to manage a public forest for production purposes.\r\n"},"90":{"name":"forest concessions","description":"A legal agreement allowing an entity the right to manage a public forest for production purposes.\r\n"},"53":{"name":"forest degradation","description":"The reduction in a forest\u2019s ability to perform ecosystem services, such as carbon storage and water regulation, due to natural and anthropogenic changes.\r\n"},"54":{"name":"forest disturbance","description":"A discrete event that changes the structure of a forest ecosystem.\r\n"},"100":{"name":"forest disturbances","description":"A discrete event that changes the structure of a forest ecosystem.\r\n"},"5":{"name":"forest fragmentation","description":"The breaking of large, contiguous forests into smaller pieces, with other land cover types interspersed.\r\n"},"6":{"name":"forest management plan","description":"A plan that documents the stewardship and use of forests and other wooded land to meet environmental, economic, social, and cultural objectives. Such plans are typically implemented by companies in forest concessions.\r\n"},"62":{"name":"forests","description":"Forests include tree cover greater than 30 percent tree canopy density and greater than 5 meters in height as mapped at a 30-meter Landsat pixel scale.\r\n"},"69":{"name":"fragmentation","description":"The breaking of large, contiguous forests into smaller pieces, with other land cover types interspersed.\r\n"},"80":{"name":"fragmented","description":"The breaking of large, contiguous forests into smaller pieces, with other land cover types interspersed.\r\n"},"74":{"name":"gain","description":"The establishment of tree canopy in an area that previously had no tree cover. Tree cover gain may indicate a number of potential activities, including natural forest growth or the crop rotation cycle of tree plantations.\r\n"},"143":{"name":"global land squeeze","description":"Pressure on finite land resources to produce food, feed and fuel for a growing human population while also sustaining biodiversity and providing ecosystem services.\r\n"},"7":{"name":"hectare","description":"One hectare equals 100 square meters, 2.47 acres, or 0.01 square kilometers and is about the size of a rugby field. A football pitch is slightly smaller than a hectare (pitches are between 0.62 and 0.82 hectares).\r\n"},"66":{"name":"hectares","description":"One hectare equals 100 square meters, 2.47 acres, or 0.01 square kilometers and is about the size of a rugby field. A football pitch is slightly smaller than a hectare (pitches are between 0.62 and 0.82 hectares).\r\n"},"67":{"name":"intact","description":"A forest that contains no signs of human activity or habitat fragmentation as determined by remote sensing images and is large enough to maintain all native biological biodiversity.\r\n"},"78":{"name":"intact forest","description":"A forest that contains no signs of human activity or habitat fragmentation as determined by remote sensing images and is large enough to maintain all native biological biodiversity.\r\n"},"8":{"name":"intact forests","description":"A forest that contains no signs of human activity or habitat fragmentation as determined by remote sensing images and is large enough to maintain all native biological biodiversity.\r\n"},"55":{"name":"land and environmental defenders","description":"People who peacefully promote and protect rights related to land and\/or the environment.\r\n"},"9":{"name":"loss driver","description":"The direct cause of forest disturbance.\r\n"},"10":{"name":"low tree canopy density","description":"Less than 30 percent tree canopy density.\r\n"},"84":{"name":"managed forest concession","description":"Areas where governments have given rights to private companies to harvest timber and other wood products from natural forests on public lands.\r\n"},"83":{"name":"managed forest concession maps for nine countries","description":"Cameroon, Canada, Central African Republic, Democratic Republic of the Congo, Equatorial Guinea, Gabon, Indonesia, Liberia, and the Republic of the Congo\r\n"},"104":{"name":"managed natural forests","description":"Naturally regenerated forests with signs of management, including logging, clear cuts, etc.\r\n"},"91":{"name":"megacities","description":"A city with more than 10 million people.\r\n"},"57":{"name":"megacity","description":"A city with more than 10 million people."},"56":{"name":"mosaic restoration","description":"Restoration that integrates trees into mixed-use landscapes, such as agricultural lands and settlements, where trees can support people through improved water quality, increased soil fertility, and other ecosystem services. This type of restoration is more likely in deforested or degraded forest landscapes with moderate population density (10\u2013100 people per square kilometer). "},"86":{"name":"natural","description":"A forest that is grown without human intervention.\r\n"},"12":{"name":"natural forest","description":"A forest that is grown without human intervention.\r\n"},"63":{"name":"natural forests","description":"A forest that is grown without human intervention.\r\n"},"144":{"name":"open canopy systems","description":"Individual tree crowns that do not overlap to form a continuous canopy layer.\r\n"},"82":{"name":"persistent gain","description":"Forests that have experienced one gain event from 2001 to 2016.\r\n"},"13":{"name":"persistent loss and gain","description":"Forests that have experienced one loss or one gain event from 2001 to 2016."},"97":{"name":"plantation","description":"An area in which trees have been planted, generally for commercial purposes.\u0026nbsp;\r\n"},"93":{"name":"plantations","description":"An area in which trees have been planted, generally for commercial purposes.\u0026nbsp;\r\n"},"88":{"name":"planted","description":"A forest composed of trees that have been deliberately planted and\/or seeded by humans.\r\n"},"14":{"name":"planted forest","description":"A forest composed of trees that have been deliberately planted and\/or seeded by humans.\r\n"},"73":{"name":"planted forests","description":"A forest composed of trees that have been deliberately planted and\/or seeded by humans.\r\n"},"15":{"name":"primary forest","description":"Old-growth forests that are typically high in carbon stock and rich in biodiversity. The GFR uses a humid tropical primary rainforest data set, representing forests in the humid tropics that have not been cleared in recent years.\r\n"},"64":{"name":"primary forests","description":"Old-growth forests that are typically high in carbon stock and rich in biodiversity. The GFR uses a humid tropical primary rainforest data set, representing forests in the humid tropics that have not been cleared in recent years.\r\n"},"58":{"name":"production forest","description":"A forest where the primary management objective is to produce timber, pulp, fuelwood, and\/or nonwood forest products."},"89":{"name":"production forests","description":"A forest where the primary management objective is to produce timber, pulp, fuelwood, and\/or nonwood forest products.\r\n"},"87":{"name":"seminatural","description":"A managed forest modified by humans, which can have a different species composition from surrounding natural forests.\r\n"},"59":{"name":"seminatural forests","description":"A managed forest modified by humans, which can have a different species composition from surrounding natural forests. "},"96":{"name":"shifting agriculture","description":"Temporary loss or permanent deforestation due to small- and medium-scale agriculture.\r\n"},"103":{"name":"surface roughness","description":"Surface roughness of forests creates\u0026nbsp;turbulence that slows near-surface winds and cools the land as it lifts heat from low-albedo leaves and moisture from evapotranspiration high into the atmosphere and slows otherwise-drying winds. \r\n"},"17":{"name":"tree cover","description":"All vegetation greater than five meters in height and may take the form of natural forests or plantations across a range of canopy densities. Unless otherwise specified, the GFR uses greater than 30 percent tree canopy density for calculations.\r\n"},"71":{"name":"tree cover canopy density is low","description":"Less than 30 percent tree canopy density.\r\n"},"60":{"name":"tree cover gain","description":"The establishment of tree canopy in an area that previously had no tree cover. Tree cover gain may indicate a number of potential activities, including natural forest growth or the crop rotation cycle of tree plantations.\u0026nbsp;As such, tree cover gain does not equate to restoration.\r\n"},"18":{"name":"tree cover loss","description":"The removal or mortality of tree cover, which can be due to a variety of factors, including mechanical harvesting, fire, disease, or storm damage. As such, loss does not equate to deforestation.\r\n"},"19":{"name":"tree plantation","description":"An agricultural plantation of fast-growing tree species on short rotations for the production of timber, pulp, or fruit.\r\n"},"72":{"name":"tree plantations","description":"An agricultural plantation of fast-growing tree species on short rotations for the production of timber, pulp, or fruit.\r\n"},"85":{"name":"trees outside forests","description":"Trees found in urban areas, alongside roads, or within agricultural land\u0026nbsp;are often referred to as Trees Outside Forests (TOF).\u202f\r\n"},"105":{"name":"unmanaged natural forests","description":"Naturally regenerated forests without any signs of management, including primary forest.\r\n"}}}
 Production Forests