Get the Latest in Your Inbox
Want to stay up to date on the state of the world’s forests? Subscribe to our mailing list.
Subscribe
How much forest has been replaced by specific agricultural commodities?
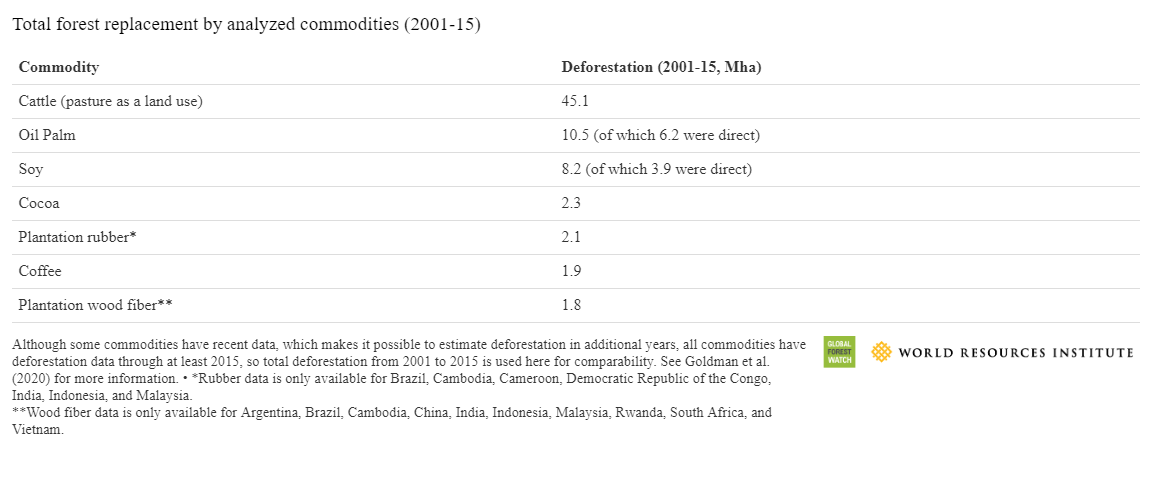
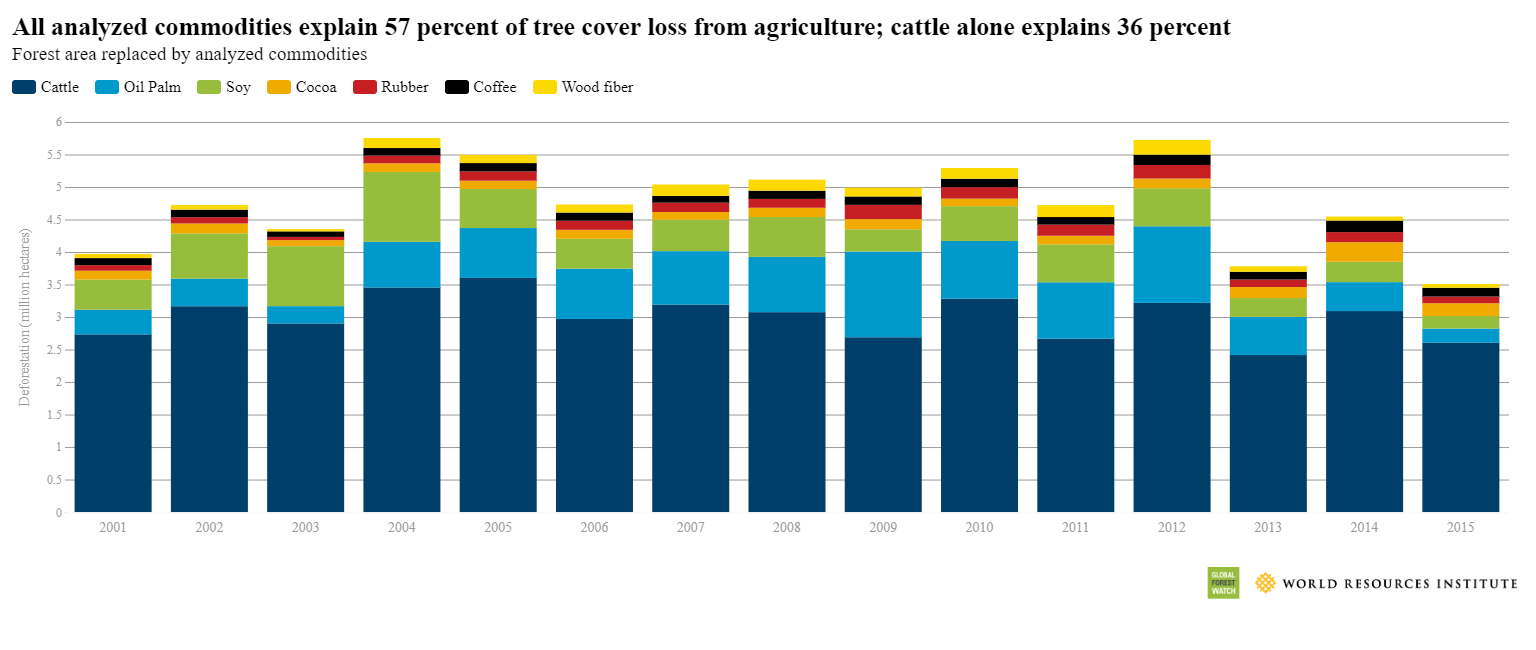
Of the seven commodities analyzed,See <a href="/gfr/data-and-methods#deforestation-forest-loss">Data and Methods</a> and Goldman et al. (2020), <a href="https://www.wri.org/publication/estimating-role-seven-commodities-agriculture-linked-deforestation">https://www.wri.org/publication/estimating-role-seven-commodities-agriculture-linked-deforestation</a> for more information about the methodology used. cattle replaced the most forest by far—cattle pasture now occupies some 45.1 million hectares (Mha) of land deforested between 2001 and 2015, accounting for 36 percent of all tree cover loss associated with agricultureAs defined by the “shifting agriculture” and “commodity-driven deforestation” classes of Curtis et al. (2018), https://doi.org/10.1126/science.aau3445 . during the time period. Oil palm ranks second (10.5 Mha), followed by soy (8.2 Mha), then cocoa, plantation rubber, coffee, and plantation wood fiber (all around 2 Mha each; though the results from rubber and wood fiber only cover a subset of countries). Together, these seven commodities account for 57 percent of all tree cover loss associated with agriculture between 2001 and 2015.This statistic has been updated from Goldman et al. 2020, https://www.wri.org/publication/estimating-role-seven-commodities-agriculture-linked-deforestation to include the latest drivers data from Curtis et al. 2018, covering the period 2001-2019.
More
Cattle replaced nearly twice as much forest as all other commodities combined<fn>Although some commodities have recent data, which makes it possible to estimate deforestation in additional years, all commodities have deforestation data through at least 2015, so total deforestation from 2001 to 2015 is used here for comparability. See <a href="https://www.wri.org/publication/estimating-role-seven-commodities-agriculture-linked-deforestation">Goldman et al. (2020)</a> for more information.</fn>
More
All analyzed commodities explain 57 percent of tree cover loss from agriculture; cattle alone explains 36 percent
More
The hot spots of forest replacement vary by commodity but are mostly concentrated in the tropics
More
Note: The maps show the area of forest replacement by each crop as a proportion of each second administrative level’s total land area. Maps of forests replaced by wood fiber and rubber plantations are not included here due to the limited data available.
More
How much forest has been replaced by cattle?
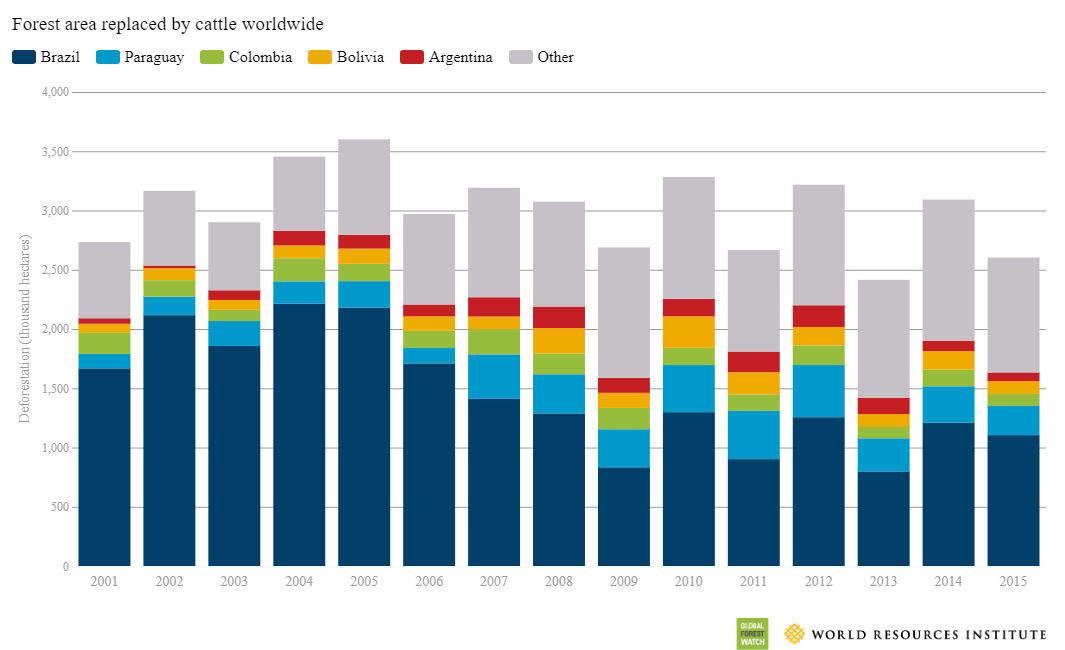
Globally, the conversion of forests to cattle pasture resulted in an estimated 45.1 Mha of deforestation between 2001 and 2015, five times more than for any of the other analyzed commodities.See <a href="/gfr/data-and-methods#deforestation-forest-loss">Data and Methods</a> and Goldman et al. (2020) for more information. The analysis assumes that clearing in pastures where cattle density is at least one head of cattle per square kilometer constitutes forest replacement by cattle. Cattle can be used for beef, dairy, and leather goods production, but pasture is also commonly used as a way to hold land for future use. Much of this deforestation occurred in Brazil (21.8 Mha, or 48 percent), followed by Paraguay (9 percent) and Colombia (5 percent). The states of Pará and Mato Grosso in Brazil experienced the greatest area of forest replaced by cattle, with around 5 Mha each between 2001 and 2015.
More
Forest replacement by cattle is most prevalent in Brazil and Paraguay
More
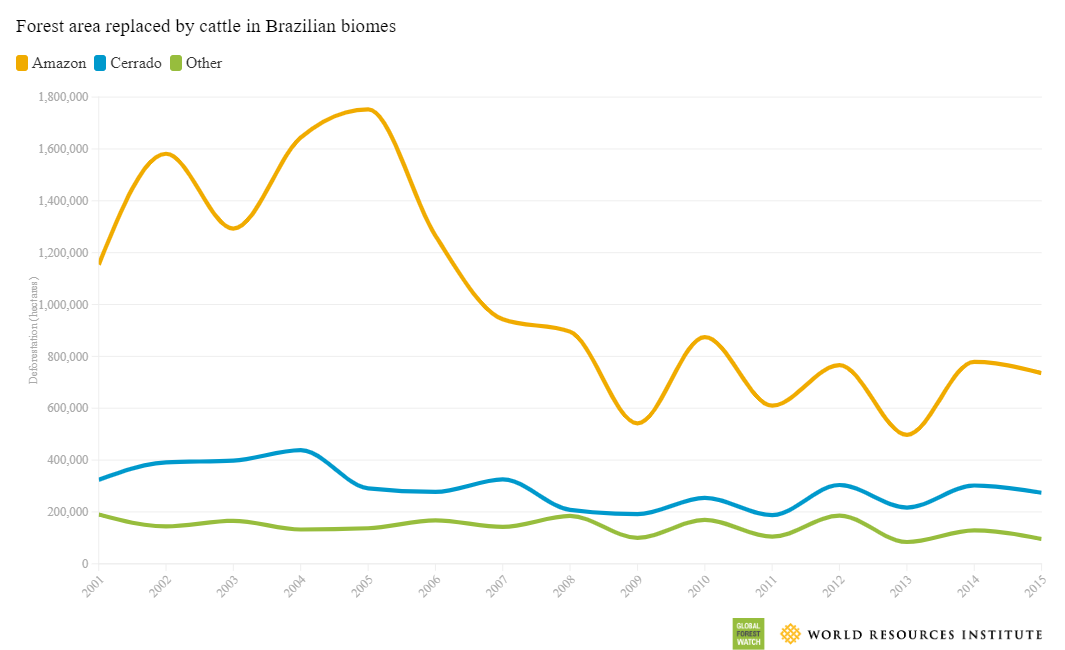
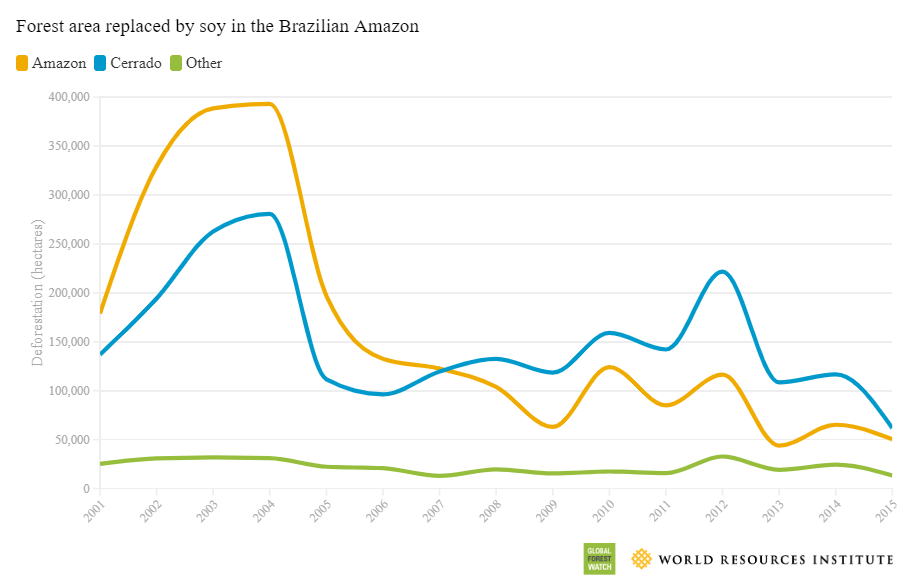
In Brazil, based on detailed pasture maps available from the Image Processing and Geoprocessing Laboratory (Laboratório de Processamento de Imagens e Geoprocessamento; LAPIG) for the year 2018, just over half of the country’s total tree cover loss area between 2001 and 2015 (42.2 Mha) was deforestation for pasture. Seventy percent of this deforestation occurred in the Brazilian Amazon, and another 20 percent occurred in the Cerrado. In the Amazon, deforestation linked to pasture peaked in 2005, then dropped to around half that level thereafter. Deforestation in the Cerrado peaked in 2004 but was followed by a much less dramatic decline than in the Amazon. The timing of the declines in both biomes corresponds to interventions and changes in public policy to reduce deforestation within the Brazilian Legal Amazon, which also includes part of the Cerrado.
More
Forest area replaced by cattle accounts for 36 percent of all agriculture-linked tree cover loss worldwide
More
The Amazon accounted for 70 percent of forest area replaced by cattle in Brazil, with an additional 20 percent occurring in the Cerrado
More
Motives for converting forests to pasture involve multiple interacting factors. Studies have shown pasture expansion occurring despite very low or negative profit margins for ranching.Carrero and Fearnside 2011, https://www.jstor.org/stable/26268895; Dávalos et al. 2014, https://doi.org/10.1016/j.biocon.2013.12.018 . Landholders may convert forests to pasture as a form of land speculation, in order to secure their land tenure, or for social and cultural reasons rather than to make a profit.Brown et al. 2016, https://doi.org/10.1016/j.landusepol.2016.02.003; Carrero and Fearnside 2011, https://www.jstor.org/stable/26268895; Garrett et al. 2017, https://par.nsf.gov/servlets/purl/10088017 . The average productivity of pastureland in Brazil is far below its potential; however, this also means that it is possible to meet Brazil’s future demands for meat without clearing additional forest.Strassburg et al. 2014, https://doi.org/10.1016/j.gloenvcha.2014.06.001 .
In addition, research has suggested that soy expansion is tightly linked to deforestation for pasture; as soy production expands into former pastures, it pushes pasture farther into forested lands and increases the value of land.Richards et al. 2014, https://doi.org/10.1016/j.gloenvcha.2014.06.011 . As such, the high numbers presented here for forest area replaced by cattle may not be the result of direct demand for beef or dairy production but rather due to displacement caused by other crops or speculation.
More
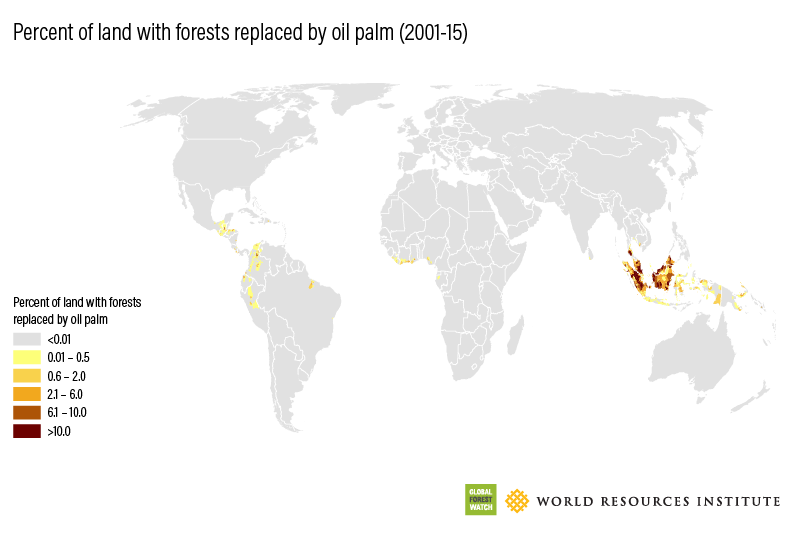
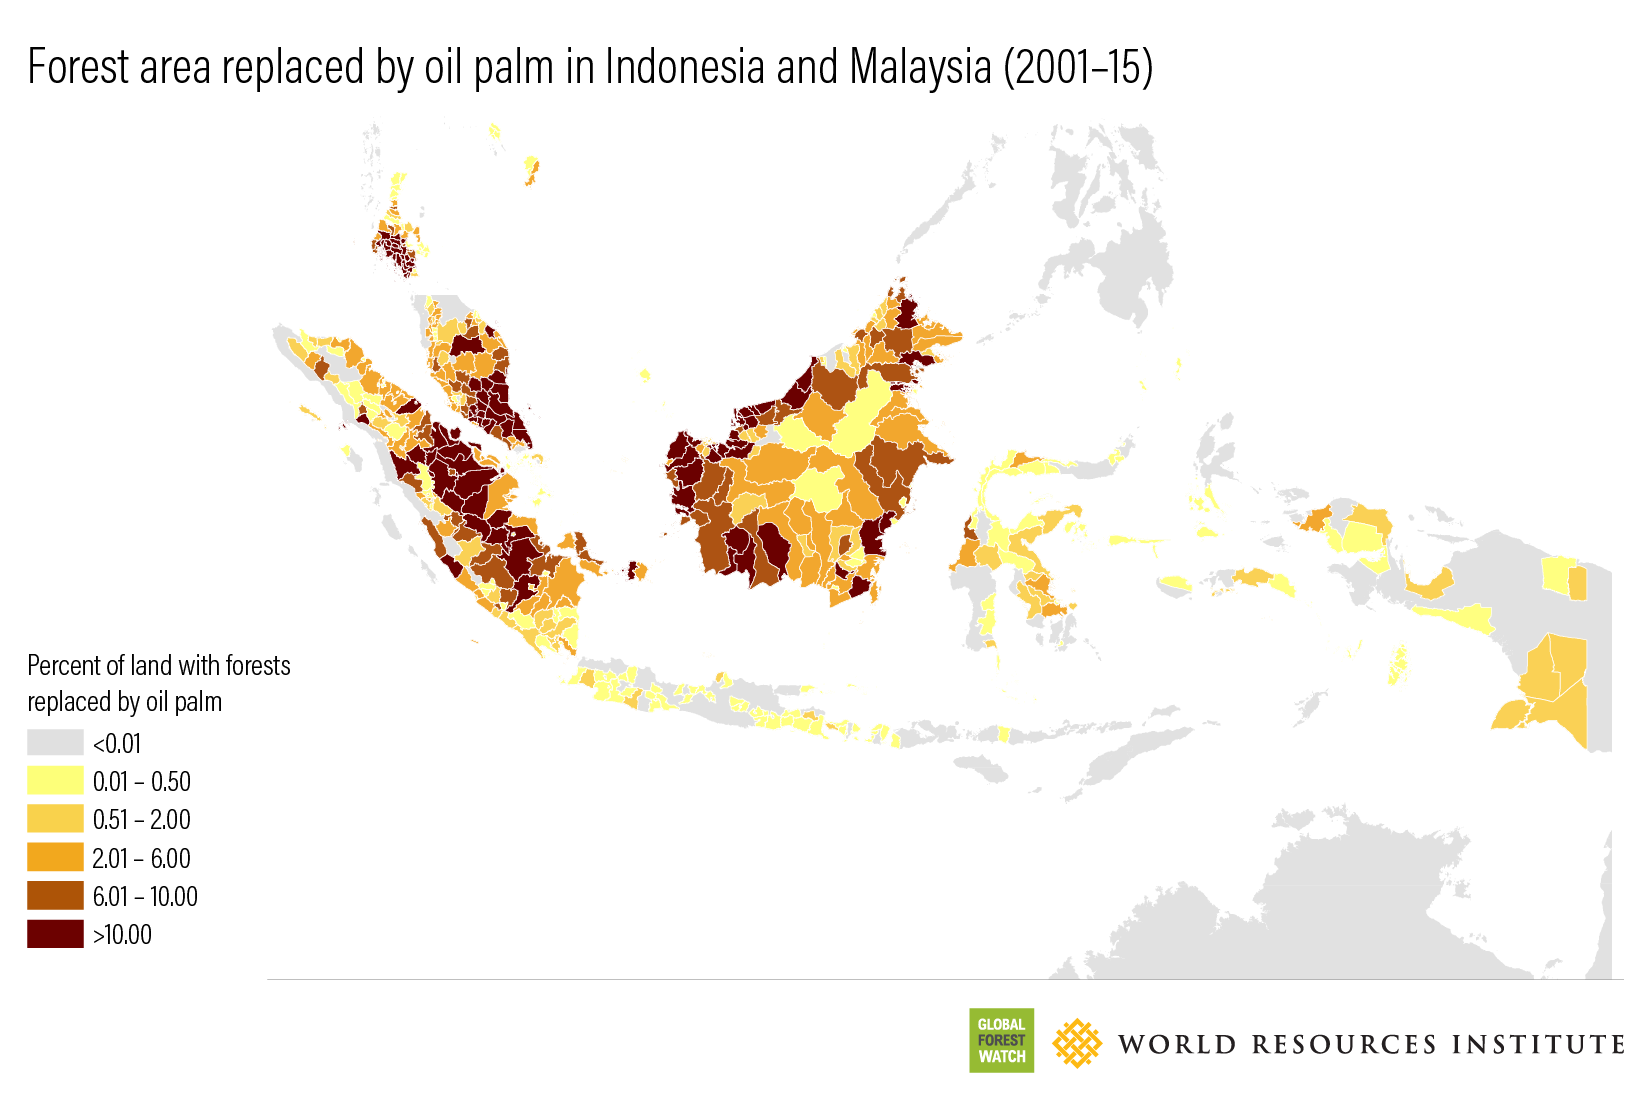
How much forest has been replaced by oil palm?
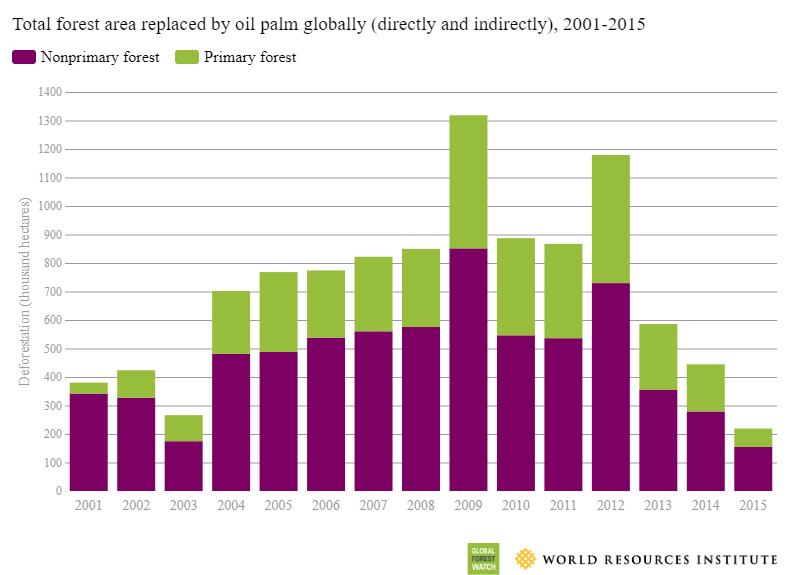
Between 2001 and 2015, oil palm plantations expanded by 22.4 Mha globally, increasing the total footprint of oil palm by 167 percent.Based on data from Harris et al. (2019), https://www.wri.org/publication/planted-trees . More detail is available in Goldman et al. (2020), https://www.wri.org/publication/estimating-role-seven-commodities-agriculture-linked-deforestation . Nearly half (10.5 Mha) of this expansion occurred on land deforested since 2001, with 3.5 Mha expanding onto land that was primary forest in 2001.See <a href="/gfr/data-and-methods#deforestation-forest-loss">Data and Methods</a>. For more information, see Goldman et al. (2020), <a href="https://www.wri.org/publication/estimating-role-seven-commodities-agriculture-linked-deforestation">https://www.wri.org/publication/estimating-role-seven-commodities-agriculture-linked-deforestation</a> . More than two-thirds of all deforested land now used for oil palm plantations is in Indonesia (7.0 Mha), with another 2.7 Mha in Malaysia. Forests in the provinces of Central Kalimantan, East Kalimantan, and Riau in Indonesia and Sarawak in Malaysia were particularly hard-hit, with oil palm plantations occupying more than a million hectares of land deforested between 2001 and 2015 in each of these jurisdictions. In Indonesia and Malaysia, over half (53 percent and 57 percent, respectively) of new oil palm plantations replaced forests. The countries of Liberia, Solomon Islands, and Gabon all experienced much less oil palm expansion than Indonesia and Malaysia, but more than half of that expansion resulted in deforestation (74 percent, 54 percent, and 54 percent, respectively).
More
Forest replacement by oil palm is most prevalent in Southeast Asia
More
The amount of deforestation that occurred previously on land now used for oil palm plantations increased markedly between 2001 and 2012—with peaks in 2009 and 2012–then declined to a record low in 2015 as part of a more than sixfold decline in overall deforestation rates in Indonesia and Malaysia. Studies have cited lower prices for crude palm oil (with reductions in deforestation rates generally lagging price drops by one year), Indonesia’s moratorium on new licenses to convert primary forests and peatlands (implemented in 2011), and corporate zero-deforestation commitments as possible explanations for the decline.Austin et al. 2019, https://doi.org/10.1088/1748-9326/aaf6db; Gaveau et al. 2019, https://doi.org/10.1111/conl.12622 .
More
Forest replacement by oil palm spiked in 2009 and 2012
More
The peaks in the amount of forest area replaced by oil palm correspond to peaks in palm oil prices (offset by a one-year lag)<fn>See World Bank Commodity Markets, <a href="https://www.worldbank.org/en/research/commodity-markets">https://www.worldbank.org/en/research/commodity-markets</a>.</fn>
More
Land-use conversions for oil palm plantations are not always straightforward. In Borneo, one study found that at least two-thirds of forest areas converted to industrial plantations (oil palm and wood fiber) were selectively harvested for timber prior to clearance.Gaveau et al. 2016, https://doi.org/10.1038/srep32017 . More than a quarter of oil palm plantations in Borneo (27 percent) remained cleared for longer than five years before oil palms were planted. Thus, even if forests in those areas have ultimately been replaced by oil palm plantations, it is possible they were first cleared for a different purpose. To better assess forest areas that were cleared and more immediately planted with oil palm, the analysis can be constrained to identify areas in which deforestation occurred during the four years prior to the establishment of the oil palm plantation. A total of 6.2 Mha of forest were directly converted to oil palm plantations between 2001 and 2015, showing a similar trend to overall deforestation as a result of replacement by oil palm.
More
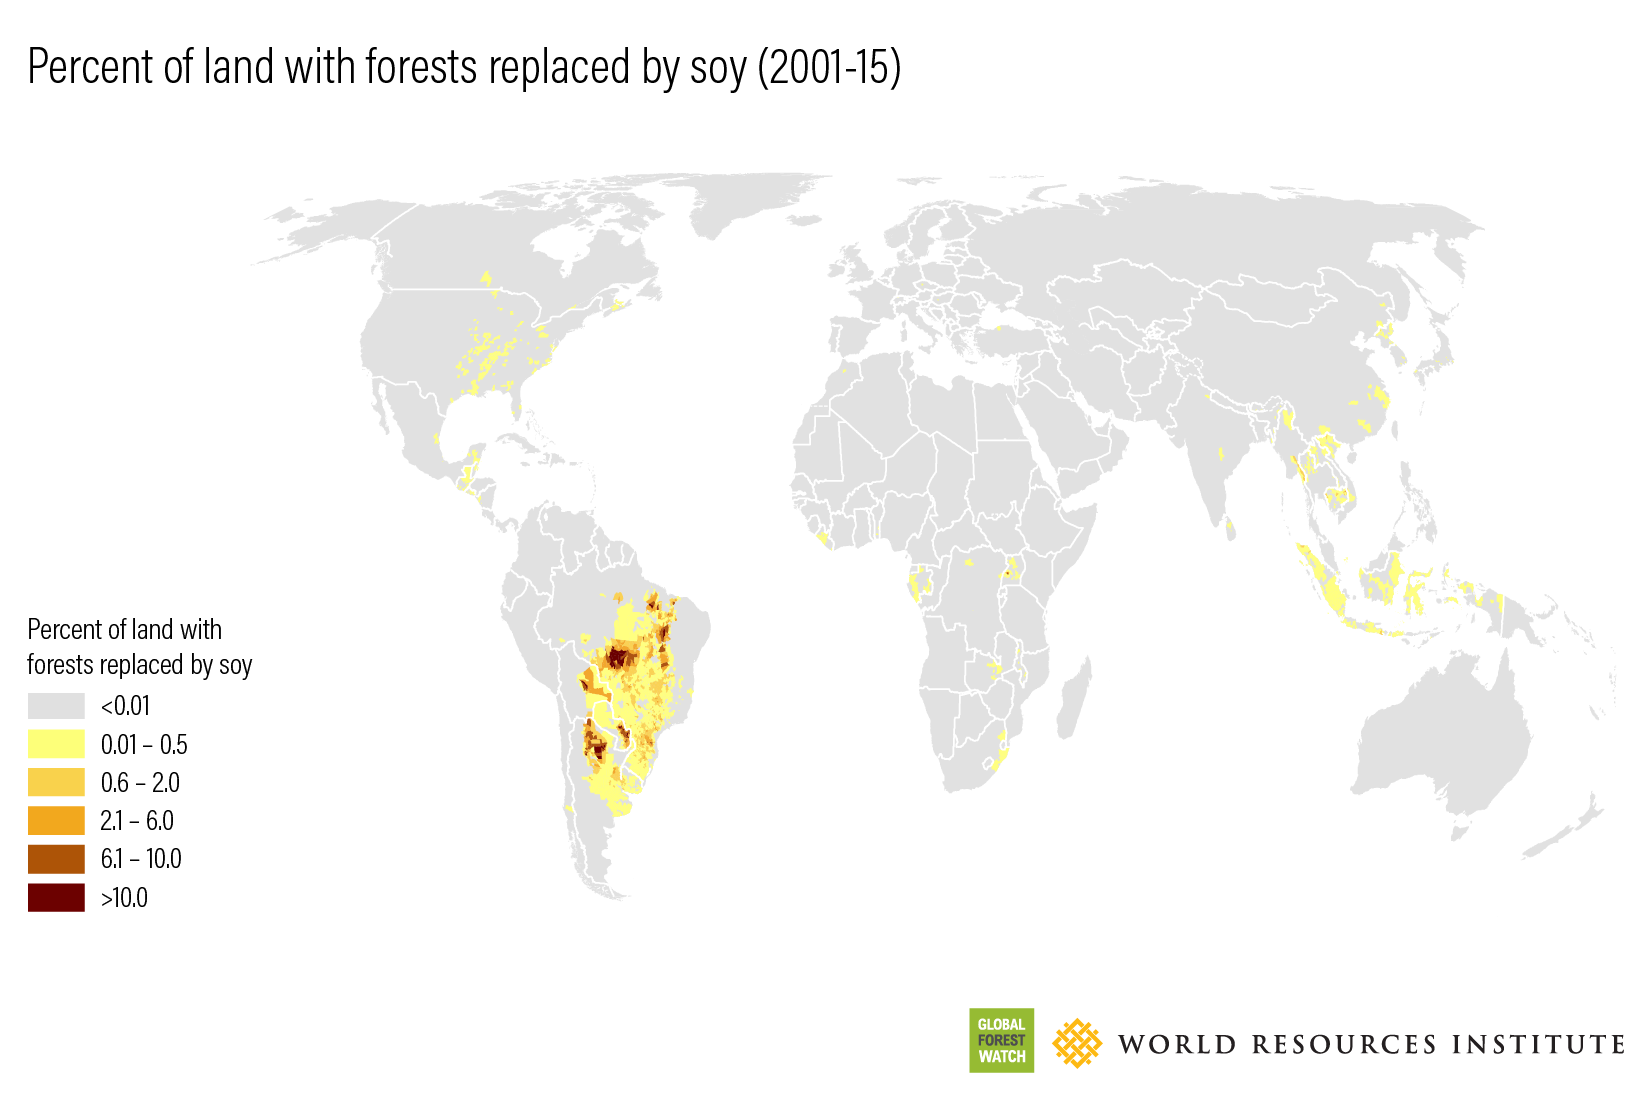
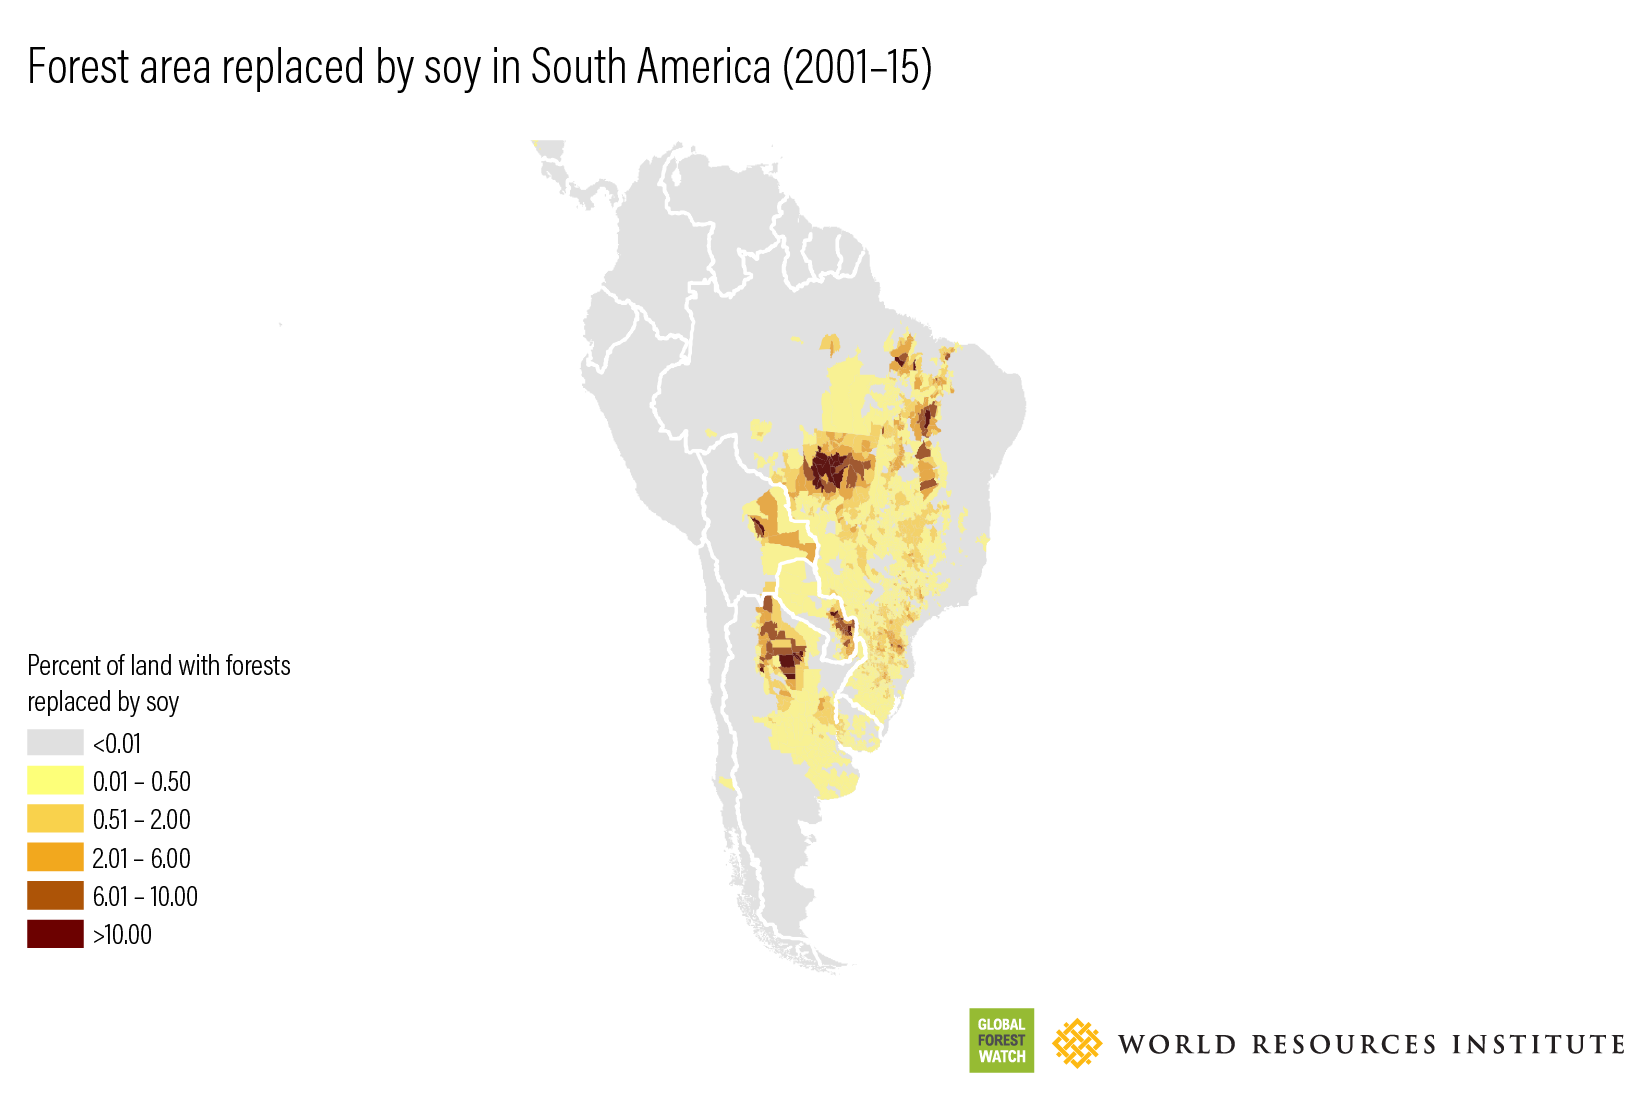
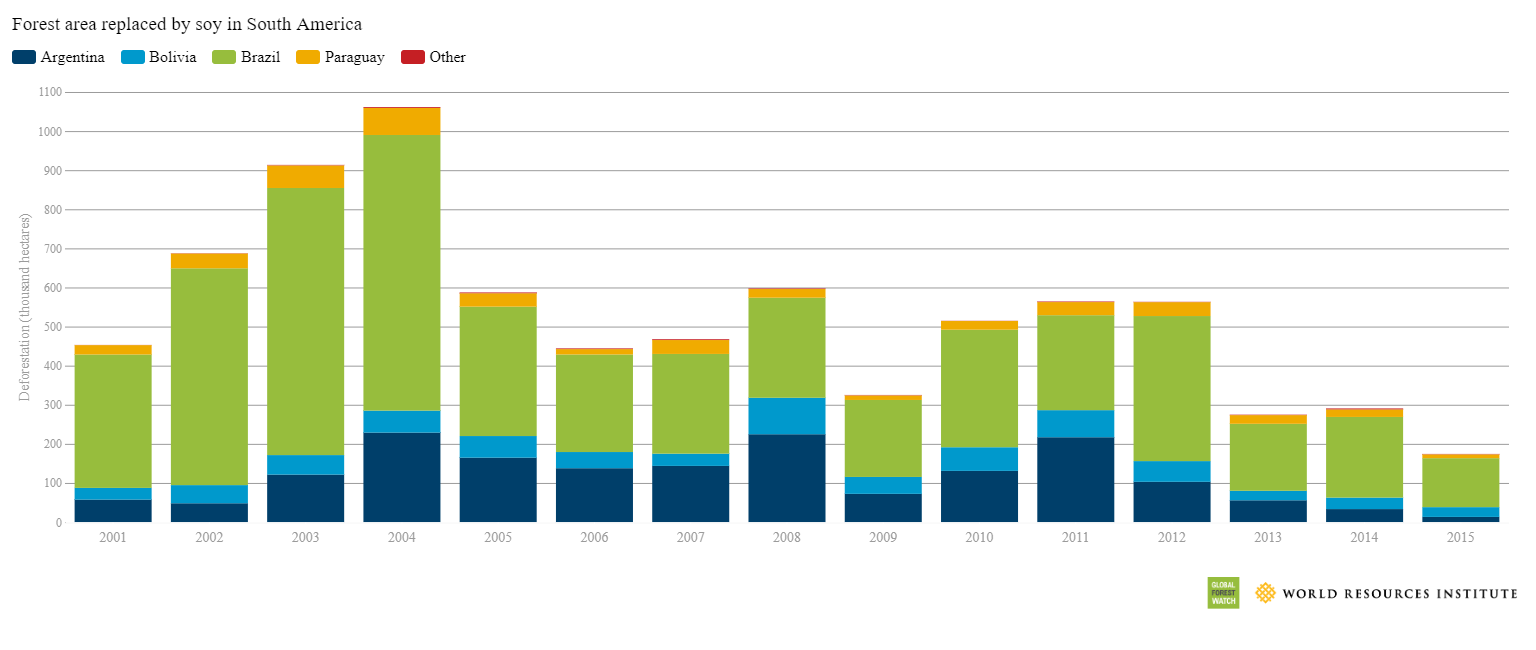
How much forest has been replaced by soy?
Globally, soy farms occupy 8.2 Mha of land deforested between 2001 and 2015.See <a href="/gfr/data-and-methods#deforestation-forest-loss">Data and Methods</a>; for more information, see also Goldman et al. (2020), <a href="https://www.wri.org/publication/estimating-role-seven-commodities-agriculture-linked-deforestation">https://www.wri.org/publication/estimating-role-seven-commodities-agriculture-linked-deforestation</a> . Almost all (97 percent) of this deforestation occurred in South America, with 61 percent in Brazil, 21 percent in Argentina, 9 percent in Bolivia, and 5 percent in Paraguay. The Brazilian state of Mato Grosso had by far the most forest replacement for soy, accounting for over one-third of the total. Within Brazil, 48 percent of forest area replaced by soy occurred in the Amazon, with an additional 45 percent in the Cerrado.
More
Forest replacement by soy is most prevalent in a few countries in South America
More
In South America, deforestation on land currently used for soy peaked in 2004 and then dropped to around half of that rate thereafter, in line with overall deforestation declines in the Brazilian Amazon, the Brazilian Cerrado, and Paraguay. There was also a second decline after 2012, most notably in Argentina.
More
The area of forest replaced by soy each year in South America has markedly decreased since 2004
More
The drop in forest area replaced by soy during the early 2000s coincides with Brazil’s federal plan to reduce deforestation rates in the Amazon (established in 2004), a dip in the profitability of soybeans (2005–7), and the industry-led “soy moratorium” on soy cultivated on recently deforested land in the Brazilian Amazon (implemented in 2006).Macedo et al. 2011, https://doi.org/10.1073/pnas.1111374109 . Paraguay and Argentina also enacted laws to reduce deforestation from agricultural expansion in 2004 and 2007, respectively.Szulecka 2017, https://www.duo.uio.no/bitstream/handle/10852/61460/Chapter.ID_48221_6x9_Julia_Szulecka.pdf?sequence=1&isAllowed=y; Volante et al. 2016, https://doi.org/10.1016/j.landusepol.2016.03.025 .
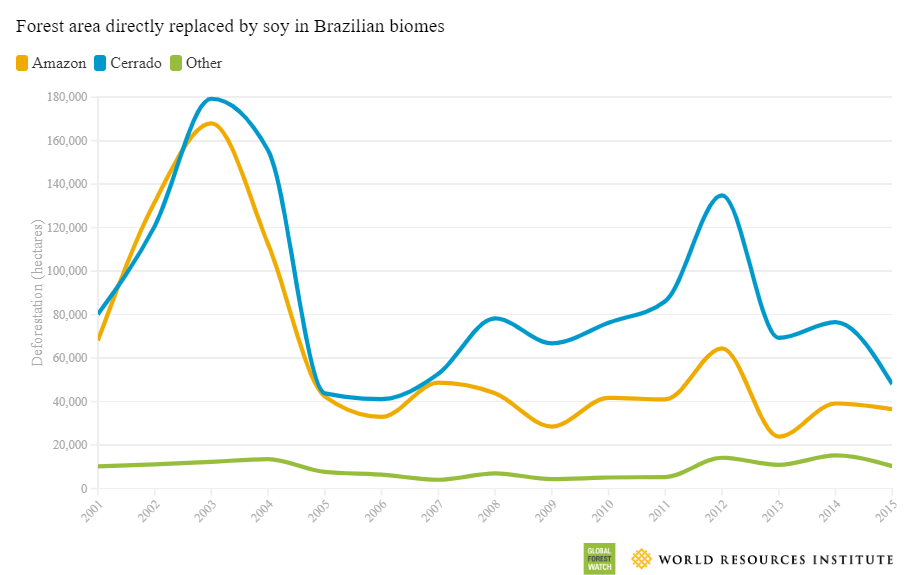
A large drop in the rate at which forests were replaced by soy occurred in the Brazilian Amazon after 2004. The Cerrado also experienced a drop in 2004, though deforestation rates on land later used for soy then rebounded before another decline starting in 2013.
The Amazon and Cerrado biomes account for most of Brazil’s forest replacement by soy
Although the rate at which forests were replaced by soy has declined substantially since the turn of the century, research suggests that soy contributes indirectly to large areas of deforestation in the Amazon.Barona et al. 2010, https://doi.org/10.1088/1748-9326/5/2/024002; Zalles et al. 2019, https://doi.org/10.1073/pnas.1810301115 . Several studies have documented an increase in soy planting on former pasture areas in Mato Grosso and the Amazon, potentially leading to a displacement of pasture that may, in turn, result in further deforestation. The analysis presented here provides a snapshot of both direct and indirect conversion of forests to soy since 2000. The analysis can also be constrained to direct conversion by looking only at those areas that were deforested within three years of the establishment of soy. Around half, or 3.9 Mha, of forest area replaced by soy represents direct conversion of forests. Focusing on direct conversion for soy also reveals different dynamics in the Brazilian Amazon and the Cerrado. In the Brazilian Cerrado, 58 percent of forest replacement by soy is direct, whereas in the Brazilian Amazon only 39 percent is direct.
How much forest has been replaced by cocoa?
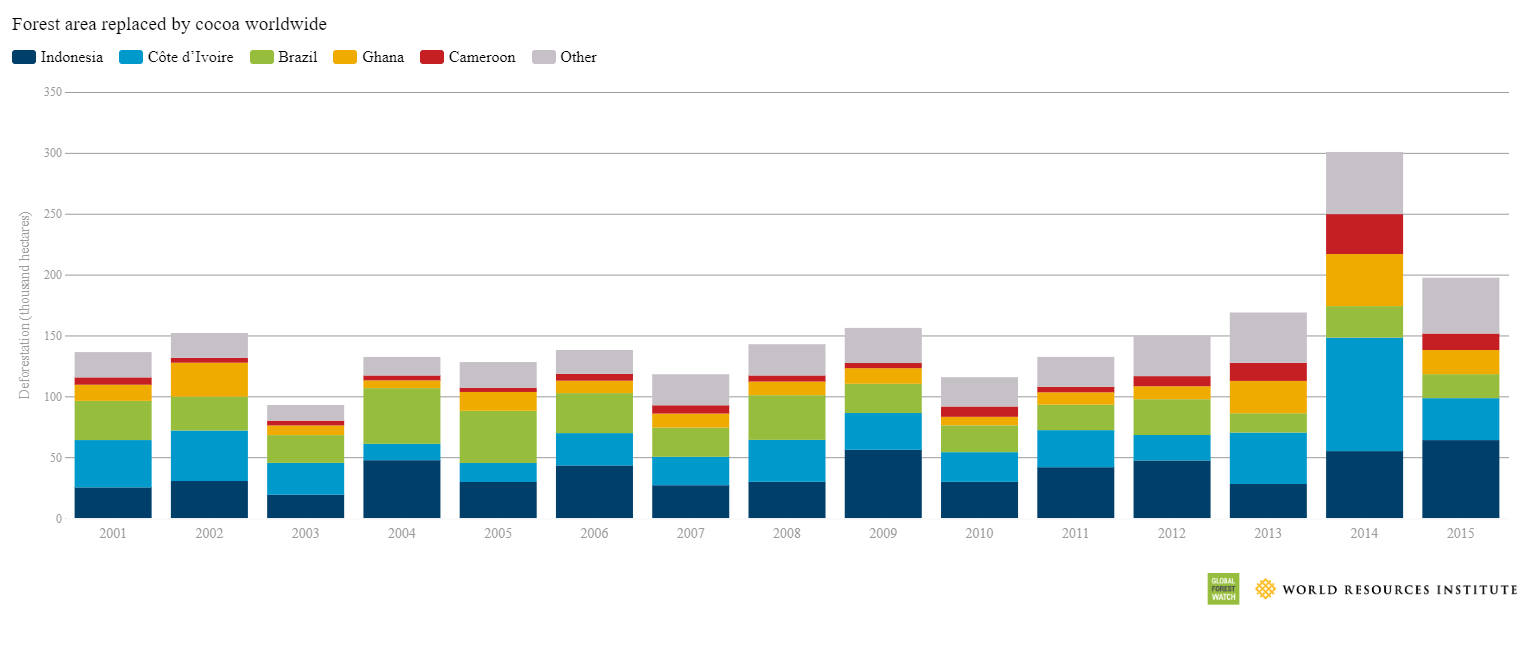
Between 2001 and 2015, cocoa farms replaced an estimated 2.3 Mha of forest globally.See <a href="/gfr/data-and-methods#deforestation-forest-loss">Data and Methods</a>; for more information, also see Goldman et al. (2020), <a href="https://www.wri.org/publication/estimating-role-seven-commodities-agriculture-linked-deforestation">https://www.wri.org/publication/estimating-role-seven-commodities-agriculture-linked-deforestation</a> . Indonesia and Côte d’Ivoire had the most forest area replaced by cocoa (25 percent and 22 percent of the global total, respectively), followed Brazil (19 percent), Ghana (10 percent), and Cameroon (6 percent). Although West African countries such as Ghana did not have the largest area of forest replaced by cocoa, the area represented a much larger share of the country’s total tree cover loss (one-third for Ghana; just over a quarter for Côte d’Ivoire). Deforestation on land later used for cocoa remained relatively steady from 2001 to 2013 but experienced a sharp increase after 2014. Meanwhile, cocoa production has steadily increased since the turn of the century, increasing by 44 percent between 2001 and 2015.See FAOSTAT, http://www.fao.org/faostat/en/#data .
More
Forest area replaced by cocoa each year worldwide peaked in 2014
More
Forest replacement by cocoa in West Africa is focused in Côte d’Ivoire, Ghana, and Cameroon
More
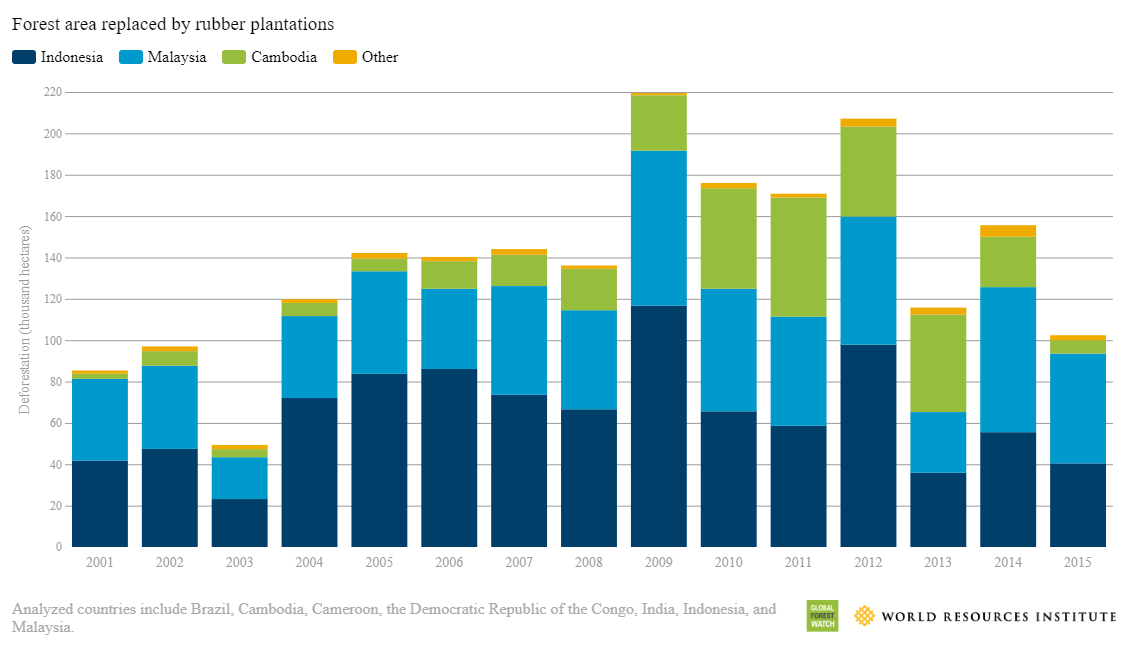
How much forest has been replaced by plantation rubber?
In the seven countries where rubber plantation data are available (Brazil, Cambodia, Cameroon, Democratic Republic of the Congo, India, Indonesia, and Malaysia), rubber plantations replaced 2.1 Mha of forest between 2001 and 2015.See <a href="/gfr/data-and-methods#deforestation-forest-loss">Data and Methods</a>; for more information, see also Goldman et al. (2020), <a href="https://www.wri.org/publication/estimating-role-seven-commodities-agriculture-linked-deforestation">https://www.wri.org/publication/estimating-role-seven-commodities-agriculture-linked-deforestation</a> . However, the analyzed countries account for only 40 percent of total rubber production, with important producing countries such as China, Thailand, and Vietnam missing due to a lack of data.See FAOSTAT, http://www.fao.org/faostat/en/#home . Of the countries analyzed, Indonesia experienced the most forest replacement by rubber plantations (1.0 Mha), followed by Malaysia (0.7 Mha). Whereas rubber was traditionally cultivated as part of intermixed agroforestry operations, monoculture plantations now dominate rubber production.See Feintrenie and Levang 2009, https://doi.org/10.1007/s11842-009-9086-2 . Deforestation on land later used for rubber plantations markedly increased from 2001 to 2012, then declined through 2015, following a similar pattern to the price for rubber, which dropped off after 2011.See World Bank Commodity Markets, https://www.worldbank.org/en/research/commodity-markets .
More
Rubber plantations replaced 2.1 Mha of forest between 2000 and 2015 <fn>Analyzed countries include Brazil, Cambodia, Cameroon, the Democratic Republic of the Congo, India, Indonesia, and Malaysia.</fn>
More
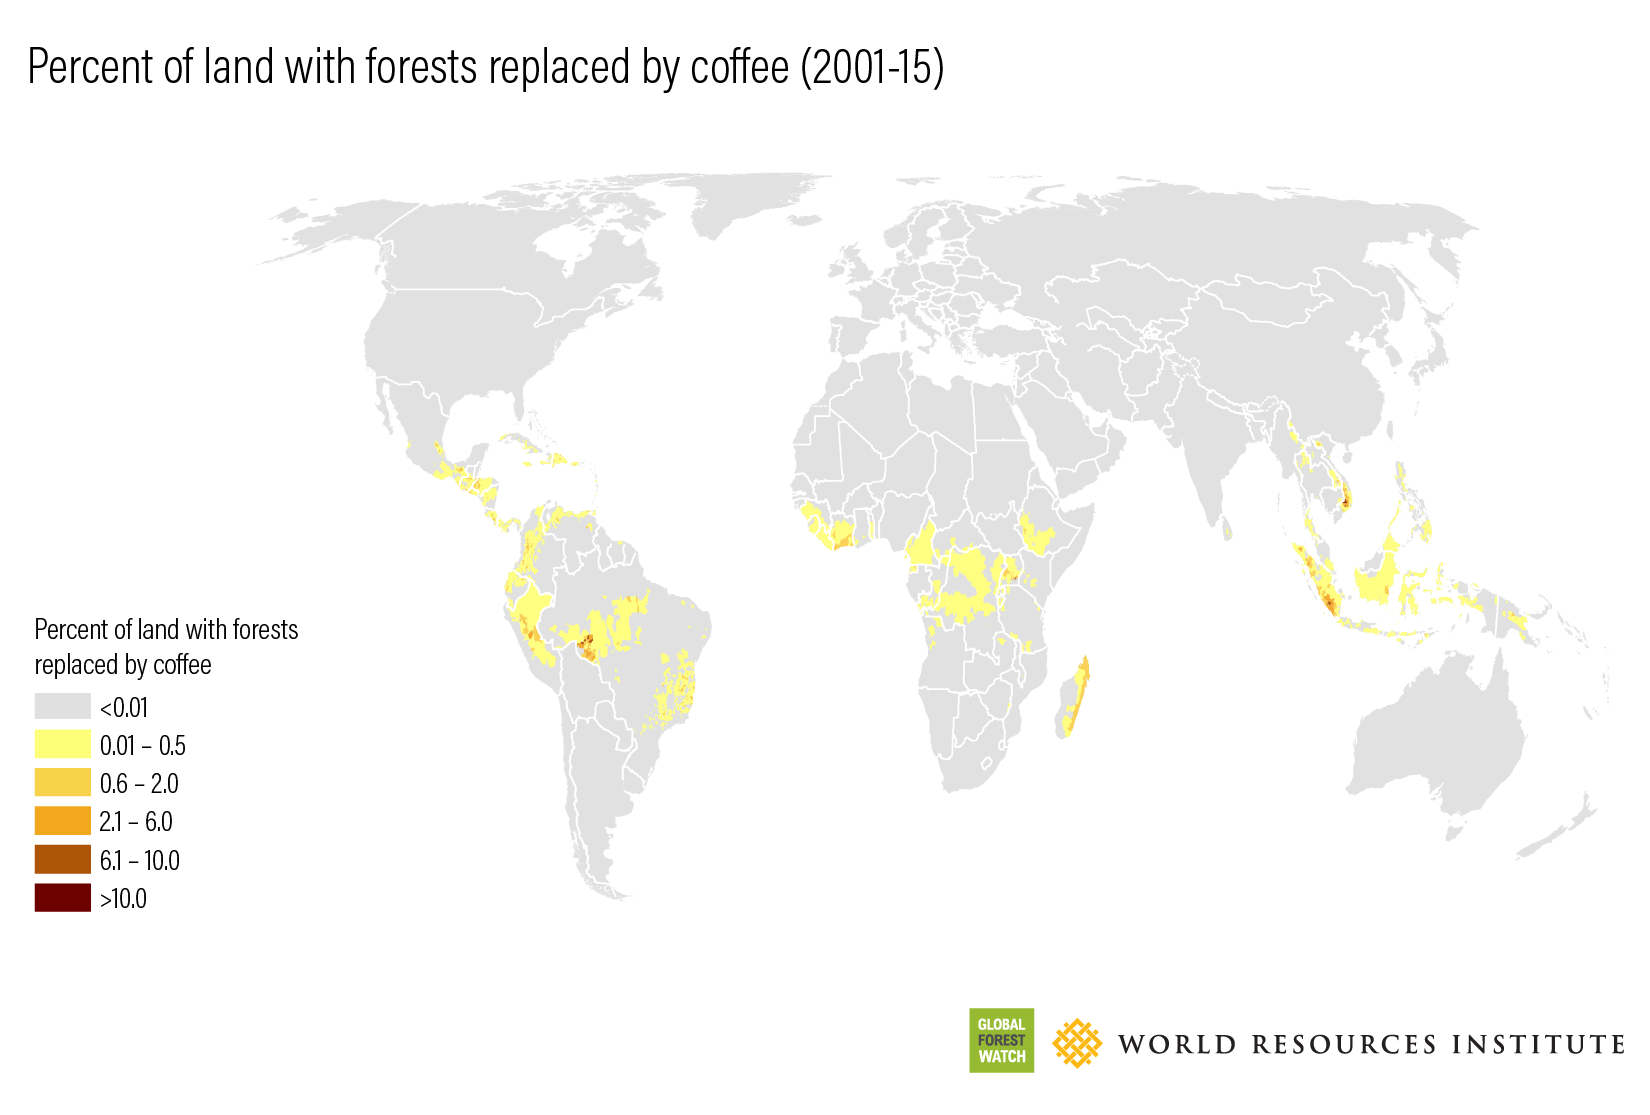
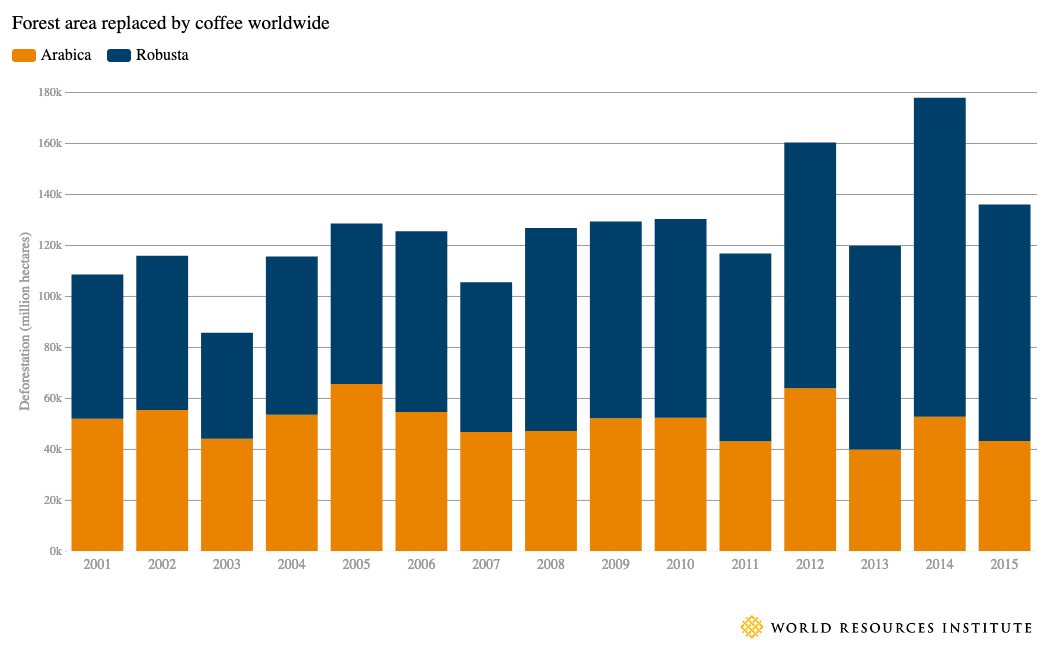
How much forest has been replaced by coffee?
Nearly 2 Mha of forest were replaced by coffee plantations between 2001 and 2015, of which 1.1 Mha were for robusta coffee and 0.8 Mha were for arabica coffee.See <a href="/gfr/data-and-methods#deforestation-forest-loss">Data and Methods</a>; for more information, see also Goldman et al. (2020), <a href="https://www.wri.org/publication/estimating-role-seven-commodities-agriculture-linked-deforestation">https://www.wri.org/publication/estimating-role-seven-commodities-agriculture-linked-deforestation</a> . Forest replacement by robusta coffee was most prevalent in Indonesia (33 percent of the global total), followed by Brazil (16 percent), Madagascar (14 percent), and Vietnam (12 percent). Forest replacement by arabica coffee was most prevalent in Brazil (36 percent), Peru (20 percent), and Colombia (8 percent).
Deforestation on land later used for robusta coffee increased markedly over the analysis period, but deforestation on land later used for arabica coffee remained steady.
Robusta, generally grown in full sun at lower latitudes, is often used in instant coffee and has seen an increase in demand from consumers in Asia and Brazil.Kurose 2019, https://asia.nikkei.com/Business/Markets/Commodities/Asians-love-for-instant-coffee-fuels-Robusta-cultivation2 . Robusta has grown from 36 percent of global coffee production in 2000 to 44 percent in 2015.See the U.S. Department of Agriculture’s Foreign Agricultural Service, https://apps.fas.usda.gov/psdonline/app/index.html#/app/advQuery . Arabica, on the other hand, typically grows in agroforestry systems at higher latitudes. Previous research has suggested that, in some cases, arabica coffee has slowed down the rate of deforestation because trees in coffee cultivation areas are spared from clearing because arabica coffee can grow in shade.Blackman et al. 2005, https://www.semanticscholar.org/paper/Deforestation-and-Shade-Coffee-in-Oaxaca%2C-Mexico%3A-Blackman-Albers/b5ca9cac55b3f1113b24fc1b5dd13a0d8301d5b6?p2df; Getahun et al. 2013, https://doi.org/10.1016/j.foreco.2013.05.001 .
More
Coffee replaced 1.9 Mha of forest between 2001 and 2015
More
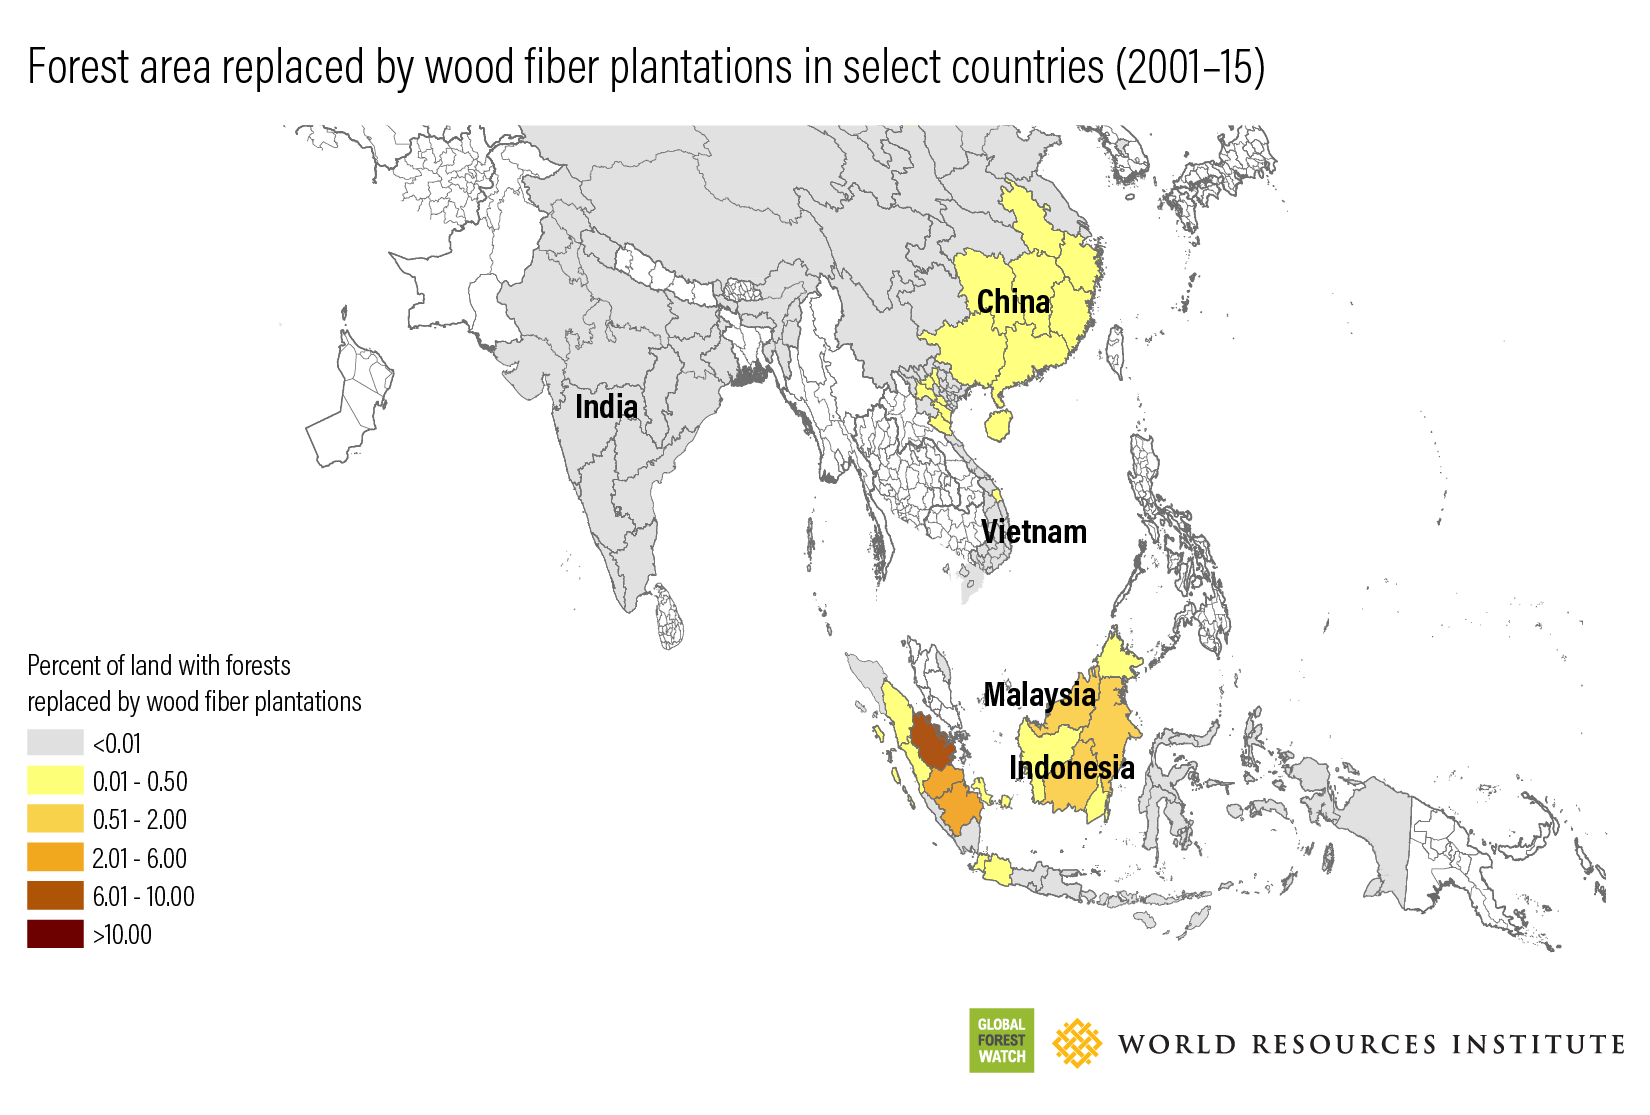
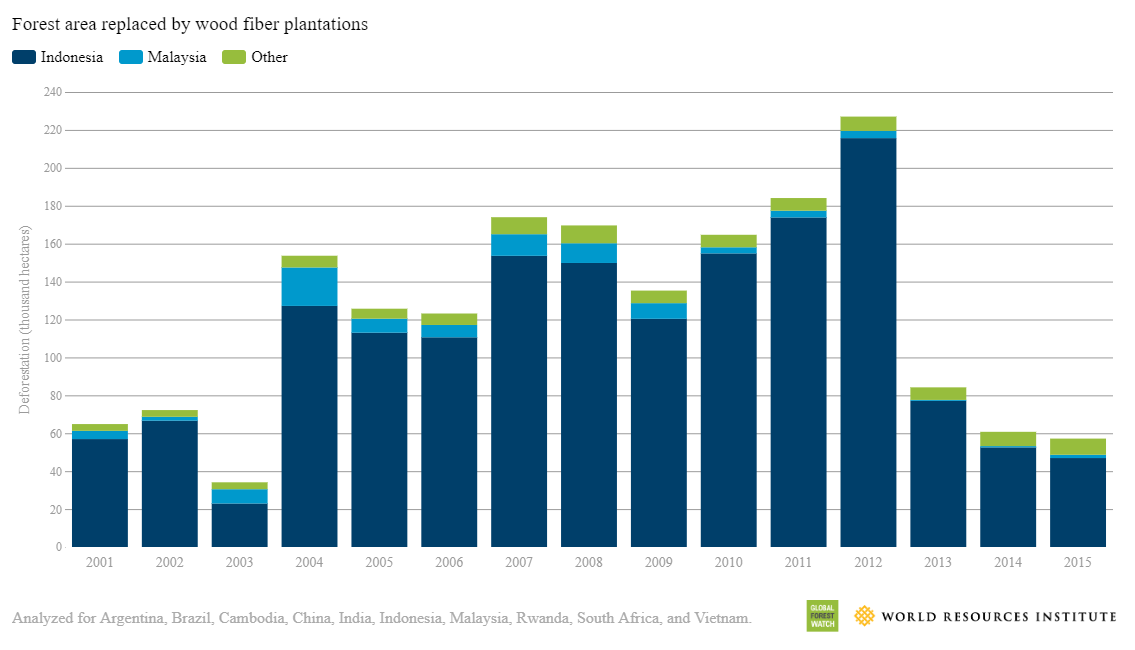
How much forest has been replaced by plantation wood fiber?
For the 10 tropical countries where wood fiber plantation data are available (Argentina, Brazil, Cambodia, China, India, Indonesia, Malaysia, Rwanda, South Africa, and Vietnam), wood fiber plantations replaced an estimated 1.8 Mha of forest between 2000 and 2015.See <a href="/gfr/data-and-methods#deforestation-forest-loss">Data and Methods</a>; for more information, see also Goldman et al. (2020), <a href="https://www.wri.org/publication/estimating-role-seven-commodities-agriculture-linked-deforestation">https://www.wri.org/publication/estimating-role-seven-commodities-agriculture-linked-deforestation</a> . By far the most forest area replaced by wood fiber plantations occurred in Indonesia, accounting for 90 percent of the measured deforestation, followed by Malaysia (5 percent) and China (4 percent).
More
Of countries with available data, forest replacement by wood fiber plantations was most prevalent in Indonesia
More
The amount of forest area replaced by wood fiber plantations each year increased during the early 2000s and decreased in recent years <fn>Analyzed for Argentina, Brazil, Cambodia, China, India, Indonesia, Malaysia, Rwanda, South Africa, and Vietnam.</fn>
More
In Indonesia, timber plantation concessions (hutan tanaman industri in Bahasa Indonesia) are areas that have been legally designated for timber plantations, but they may or may not be completely covered by plantations. Concessions lost 1.7 Mha of primary forest between 2002 and 2023, though not all of this loss was necessarily because of wood fiber production. As with the forests replaced by wood fiber plantations, loss within timber plantation concessions peaked in 2012, with a decline beginning in 2013 (though not as dramatically as in the forest replacement analysis).
Annual primary forest loss in Indonesian timber plantation concessions peaked in 2012, with a substantial decline beginning in 2013
More
Limitations and Future Prospects
The forest extent analysis is limited by various data and attribution issues and methodological assumptions, including the following:
- Commodity data sets have limited coverage and quality. Only oil palm has recent, detailed maps of extent at a global level, and even these maps likely exclude many small-scale plantations. The analysis also uses detailed data on South American soy, Brazilian pasture, and wood fiber and rubber plantations for select countries. Outside of these regions and commodities, the analysis relies on global 10-kilometer resolution data on crop and pasture extent.For more information, see Goldman et al. (2020), https://www.wri.org/publication/estimating-role-seven-commodities-agriculture-linked-deforestation . Due to the coarse resolution of these data, and the assumptions the coarseness necessitates, the results are likely to be less accurate. Furthermore, these data are from 2010 (2000 for pasture), so the amount of forest replaced by a specific commodity is assumed to be proportional to its area during that year and may be misrepresented if significant expansion or contraction of that commodity has occurred since then.
- The data cannot capture complex land-use change transitions. The analyses presented here do not take into account other possible land uses between the deforestation event and the establishment of the commodity, except in the cases of oil palm and soy, where we include estimates of direct deforestation. The analysis also does not consider any forms of indirect land-use change (e.g., the target commodity displacing other activities that may, in turn, expand into forested areas). Including indirect land-use change could change the amount of deforestation attributed to each commodity, especially for oil palm, soy, and cattle.
- The data measure tree cover loss rather than deforestation directly. All tree cover loss in an area later used for one of the target commodities is assumed to be deforestation because replacement of a forest with a crop or pasture represents a permanent land-use change. Historical data from Indonesia and Malaysia are used to filter out oil palm plantations established prior to 2000 from the analysis to avoid counting the felling of old, unproductive oil palm trees as tree cover loss.For more information about the data sets used in this analysis, see Goldman et al. (2020), https://www.wri.org/publication/estimating-role-seven-commodities-agriculture-linked-deforestation . However, it is possible that some plantation dynamics in oil palm plantations outside Indonesia and Malaysia, or for other types of plantations, are included in the figures and result in an overestimation of deforestation.
- The data may miss some forms of tree cover loss. The tree cover loss data may not detect all changes related to commodity production. Much of the production of cocoa and coffee occurs on very small farms (less than one hectare) that may not be captured by the Hansen et al. (2013)Hansen et al. 2013, https://doi.org/10.1126/science.1244693 . tree cover loss data, resulting in an underestimation of deforestation for these commodities. The analysis may also underestimate the conversion of dry forest and woody savanna areas, which are not well represented in the Hansen et al. (2013) tree cover loss data. For the detailed soy and pasture analyses, we define tree cover as any woody vegetation with a minimum of 10 percent canopy cover (analyses for other commodities use 30 percent) to minimize underestimations in South American biomes such as the Cerrado and the Chaco, where these commodities play a big role.For more information about the methodology, see Goldman et al. (2020), https://www.wri.org/publication/estimating-role-seven-commodities-agriculture-linked-deforestation .
Further discussion about the methods, assumptions, and limitations of this analysis is available in Goldman et al. (2020).
More
{"Glossary":{"51":{"name":"agricultural tree crops","description":"Trees cultivated for their food, cultural, or economic values. These include oil palm, rubber, cocoa, cashew, mango, oranges (citrus), plantain, banana, and coconut.\r\n"},"141":{"name":"agroforestry","description":"A diversified set of agricultural or agropastoral production systems that integrate trees in the agricultural landscape.\r\n"},"101":{"name":"albedo","description":"The ability of surfaces to reflect sunlight.\u0026nbsp;Light-colored surfaces return a large part of the sunrays back to the atmosphere (high albedo). Dark surfaces absorb the rays from the sun (low albedo).\r\n"},"94":{"name":"biodiversity intactness","description":"The proportion and abundance of a location\u0027s original forest community (number of species and individuals) that remain.\u0026nbsp;\r\n"},"95":{"name":"biodiversity significance","description":"The importance of an area for the persistence of forest-dependent species based on range rarity.\r\n"},"142":{"name":"boundary plantings","description":"Trees planted along boundaries or property lines to mark them well.\r\n"},"98":{"name":"carbon dioxide equivalent (CO2e)","description":"Carbon dioxide equivalent (CO2e) is a measure used to aggregate emissions from various greenhouse gases (GHGs) on the basis of their 100-year global warming potentials by equating non-CO2 GHGs to the equivalent amount of CO2.\r\n"},"99":{"name":"CO2e","description":"Carbon dioxide equivalent (CO2e) is a measure used to aggregate emissions from various greenhouse gases (GHGs) on the basis of their 100-year global warming potentials by equating non-CO2 GHGs to the equivalent amount of CO2.\r\n"},"1":{"name":"deforestation","description":"The change from forest to another land cover or land use, such as forest to plantation or forest to urban area.\r\n"},"77":{"name":"deforested","description":"The change from forest to another land cover or land use, such as forest to plantation or forest to urban area.\r\n"},"76":{"name":"degradation","description":"The reduction in a forest\u2019s ability to perform ecosystem services, such as carbon storage and water regulation, due to natural and anthropogenic changes.\r\n"},"75":{"name":"degraded","description":"The reduction in a forest\u2019s ability to perform ecosystem services, such as carbon storage and water regulation, due to natural and anthropogenic changes.\r\n"},"79":{"name":"disturbances","description":"A discrete event that changes the structure of a forest ecosystem.\r\n"},"68":{"name":"disturbed","description":"A discrete event that changes the structure of a forest ecosystem.\r\n"},"65":{"name":"driver of tree cover loss","description":"The direct cause of forest disturbance.\r\n"},"70":{"name":"drivers of loss","description":"The direct cause of forest disturbance.\r\n"},"81":{"name":"drivers of tree cover loss","description":"The direct cause of forest disturbance.\r\n"},"102":{"name":"evapotranspiration","description":"When solar energy hitting a forest converts liquid water into water vapor (carrying energy as latent heat) through evaporation and transpiration.\r\n"},"2":{"name":"forest","description":"Forests include tree cover greater than 30 percent tree canopy density and greater than 5 meters in height as mapped at a 30-meter Landsat pixel scale.\r\n"},"3":{"name":"forest concession","description":"A legal agreement allowing an entity the right to manage a public forest for production purposes.\r\n"},"90":{"name":"forest concessions","description":"A legal agreement allowing an entity the right to manage a public forest for production purposes.\r\n"},"53":{"name":"forest degradation","description":"The reduction in a forest\u2019s ability to perform ecosystem services, such as carbon storage and water regulation, due to natural and anthropogenic changes.\r\n"},"54":{"name":"forest disturbance","description":"A discrete event that changes the structure of a forest ecosystem.\r\n"},"100":{"name":"forest disturbances","description":"A discrete event that changes the structure of a forest ecosystem.\r\n"},"5":{"name":"forest fragmentation","description":"The breaking of large, contiguous forests into smaller pieces, with other land cover types interspersed.\r\n"},"6":{"name":"forest management plan","description":"A plan that documents the stewardship and use of forests and other wooded land to meet environmental, economic, social, and cultural objectives. Such plans are typically implemented by companies in forest concessions.\r\n"},"62":{"name":"forests","description":"Forests include tree cover greater than 30 percent tree canopy density and greater than 5 meters in height as mapped at a 30-meter Landsat pixel scale.\r\n"},"69":{"name":"fragmentation","description":"The breaking of large, contiguous forests into smaller pieces, with other land cover types interspersed.\r\n"},"80":{"name":"fragmented","description":"The breaking of large, contiguous forests into smaller pieces, with other land cover types interspersed.\r\n"},"74":{"name":"gain","description":"The establishment of tree canopy in an area that previously had no tree cover. Tree cover gain may indicate a number of potential activities, including natural forest growth or the crop rotation cycle of tree plantations.\r\n"},"143":{"name":"global land squeeze","description":"Pressure on finite land resources to produce food, feed and fuel for a growing human population while also sustaining biodiversity and providing ecosystem services.\r\n"},"7":{"name":"hectare","description":"One hectare equals 100 square meters, 2.47 acres, or 0.01 square kilometers and is about the size of a rugby field. A football pitch is slightly smaller than a hectare (pitches are between 0.62 and 0.82 hectares).\r\n"},"66":{"name":"hectares","description":"One hectare equals 100 square meters, 2.47 acres, or 0.01 square kilometers and is about the size of a rugby field. A football pitch is slightly smaller than a hectare (pitches are between 0.62 and 0.82 hectares).\r\n"},"67":{"name":"intact","description":"A forest that contains no signs of human activity or habitat fragmentation as determined by remote sensing images and is large enough to maintain all native biological biodiversity.\r\n"},"78":{"name":"intact forest","description":"A forest that contains no signs of human activity or habitat fragmentation as determined by remote sensing images and is large enough to maintain all native biological biodiversity.\r\n"},"8":{"name":"intact forests","description":"A forest that contains no signs of human activity or habitat fragmentation as determined by remote sensing images and is large enough to maintain all native biological biodiversity.\r\n"},"55":{"name":"land and environmental defenders","description":"People who peacefully promote and protect rights related to land and\/or the environment.\r\n"},"9":{"name":"loss driver","description":"The direct cause of forest disturbance.\r\n"},"10":{"name":"low tree canopy density","description":"Less than 30 percent tree canopy density.\r\n"},"84":{"name":"managed forest concession","description":"Areas where governments have given rights to private companies to harvest timber and other wood products from natural forests on public lands.\r\n"},"83":{"name":"managed forest concession maps for nine countries","description":"Cameroon, Canada, Central African Republic, Democratic Republic of the Congo, Equatorial Guinea, Gabon, Indonesia, Liberia, and the Republic of the Congo\r\n"},"104":{"name":"managed natural forests","description":"Naturally regenerated forests with signs of management, including logging, clear cuts, etc.\r\n"},"91":{"name":"megacities","description":"A city with more than 10 million people.\r\n"},"57":{"name":"megacity","description":"A city with more than 10 million people."},"56":{"name":"mosaic restoration","description":"Restoration that integrates trees into mixed-use landscapes, such as agricultural lands and settlements, where trees can support people through improved water quality, increased soil fertility, and other ecosystem services. This type of restoration is more likely in deforested or degraded forest landscapes with moderate population density (10\u2013100 people per square kilometer). "},"86":{"name":"natural","description":"A forest that is grown without human intervention.\r\n"},"12":{"name":"natural forest","description":"A forest that is grown without human intervention.\r\n"},"63":{"name":"natural forests","description":"A forest that is grown without human intervention.\r\n"},"144":{"name":"open canopy systems","description":"Individual tree crowns that do not overlap to form a continuous canopy layer.\r\n"},"82":{"name":"persistent gain","description":"Forests that have experienced one gain event from 2001 to 2016.\r\n"},"13":{"name":"persistent loss and gain","description":"Forests that have experienced one loss or one gain event from 2001 to 2016."},"97":{"name":"plantation","description":"An area in which trees have been planted, generally for commercial purposes.\u0026nbsp;\r\n"},"93":{"name":"plantations","description":"An area in which trees have been planted, generally for commercial purposes.\u0026nbsp;\r\n"},"88":{"name":"planted","description":"A forest composed of trees that have been deliberately planted and\/or seeded by humans.\r\n"},"14":{"name":"planted forest","description":"A forest composed of trees that have been deliberately planted and\/or seeded by humans.\r\n"},"73":{"name":"planted forests","description":"A forest composed of trees that have been deliberately planted and\/or seeded by humans.\r\n"},"15":{"name":"primary forest","description":"Old-growth forests that are typically high in carbon stock and rich in biodiversity. The GFR uses a humid tropical primary rainforest data set, representing forests in the humid tropics that have not been cleared in recent years.\r\n"},"64":{"name":"primary forests","description":"Old-growth forests that are typically high in carbon stock and rich in biodiversity. The GFR uses a humid tropical primary rainforest data set, representing forests in the humid tropics that have not been cleared in recent years.\r\n"},"58":{"name":"production forest","description":"A forest where the primary management objective is to produce timber, pulp, fuelwood, and\/or nonwood forest products."},"89":{"name":"production forests","description":"A forest where the primary management objective is to produce timber, pulp, fuelwood, and\/or nonwood forest products.\r\n"},"87":{"name":"seminatural","description":"A managed forest modified by humans, which can have a different species composition from surrounding natural forests.\r\n"},"59":{"name":"seminatural forests","description":"A managed forest modified by humans, which can have a different species composition from surrounding natural forests. "},"96":{"name":"shifting agriculture","description":"Temporary loss or permanent deforestation due to small- and medium-scale agriculture.\r\n"},"103":{"name":"surface roughness","description":"Surface roughness of forests creates\u0026nbsp;turbulence that slows near-surface winds and cools the land as it lifts heat from low-albedo leaves and moisture from evapotranspiration high into the atmosphere and slows otherwise-drying winds. \r\n"},"17":{"name":"tree cover","description":"All vegetation greater than five meters in height and may take the form of natural forests or plantations across a range of canopy densities. Unless otherwise specified, the GFR uses greater than 30 percent tree canopy density for calculations.\r\n"},"71":{"name":"tree cover canopy density is low","description":"Less than 30 percent tree canopy density.\r\n"},"60":{"name":"tree cover gain","description":"The establishment of tree canopy in an area that previously had no tree cover. Tree cover gain may indicate a number of potential activities, including natural forest growth or the crop rotation cycle of tree plantations.\u0026nbsp;As such, tree cover gain does not equate to restoration.\r\n"},"18":{"name":"tree cover loss","description":"The removal or mortality of tree cover, which can be due to a variety of factors, including mechanical harvesting, fire, disease, or storm damage. As such, loss does not equate to deforestation.\r\n"},"19":{"name":"tree plantation","description":"An agricultural plantation of fast-growing tree species on short rotations for the production of timber, pulp, or fruit.\r\n"},"72":{"name":"tree plantations","description":"An agricultural plantation of fast-growing tree species on short rotations for the production of timber, pulp, or fruit.\r\n"},"85":{"name":"trees outside forests","description":"Trees found in urban areas, alongside roads, or within agricultural land\u0026nbsp;are often referred to as Trees Outside Forests (TOF).\u202f\r\n"},"105":{"name":"unmanaged natural forests","description":"Naturally regenerated forests without any signs of management, including primary forest.\r\n"}}}


