The Complete Menu: Creating a Sustainable Food Future (Synthesis)
{"Glossary":{"51":{"name":"agricultural tree crops","description":"Trees cultivated for their food, cultural, or economic values. These include oil palm, rubber, cocoa, cashew, mango, oranges (citrus), plantain, banana, and coconut.\r\n"},"141":{"name":"agroforestry","description":"A diversified set of agricultural or agropastoral production systems that integrate trees in the agricultural landscape.\r\n"},"101":{"name":"albedo","description":"The ability of surfaces to reflect sunlight.\u0026nbsp;Light-colored surfaces return a large part of the sunrays back to the atmosphere (high albedo). Dark surfaces absorb the rays from the sun (low albedo).\r\n"},"94":{"name":"biodiversity intactness","description":"The proportion and abundance of a location\u0027s original forest community (number of species and individuals) that remain.\u0026nbsp;\r\n"},"95":{"name":"biodiversity significance","description":"The importance of an area for the persistence of forest-dependent species based on range rarity.\r\n"},"142":{"name":"boundary plantings","description":"Trees planted along boundaries or property lines to mark them well.\r\n"},"98":{"name":"carbon dioxide equivalent (CO2e)","description":"Carbon dioxide equivalent (CO2e) is a measure used to aggregate emissions from various greenhouse gases (GHGs) on the basis of their 100-year global warming potentials by equating non-CO2 GHGs to the equivalent amount of CO2.\r\n"},"99":{"name":"CO2e","description":"Carbon dioxide equivalent (CO2e) is a measure used to aggregate emissions from various greenhouse gases (GHGs) on the basis of their 100-year global warming potentials by equating non-CO2 GHGs to the equivalent amount of CO2.\r\n"},"1":{"name":"deforestation","description":"The change from forest to another land cover or land use, such as forest to plantation or forest to urban area.\r\n"},"77":{"name":"deforested","description":"The change from forest to another land cover or land use, such as forest to plantation or forest to urban area.\r\n"},"76":{"name":"degradation","description":"The reduction in a forest\u2019s ability to perform ecosystem services, such as carbon storage and water regulation, due to natural and anthropogenic changes.\r\n"},"75":{"name":"degraded","description":"The reduction in a forest\u2019s ability to perform ecosystem services, such as carbon storage and water regulation, due to natural and anthropogenic changes.\r\n"},"79":{"name":"disturbances","description":"A discrete event that changes the structure of a forest ecosystem.\r\n"},"68":{"name":"disturbed","description":"A discrete event that changes the structure of a forest ecosystem.\r\n"},"65":{"name":"driver of tree cover loss","description":"The direct cause of forest disturbance.\r\n"},"70":{"name":"drivers of loss","description":"The direct cause of forest disturbance.\r\n"},"81":{"name":"drivers of tree cover loss","description":"The direct cause of forest disturbance.\r\n"},"102":{"name":"evapotranspiration","description":"When solar energy hitting a forest converts liquid water into water vapor (carrying energy as latent heat) through evaporation and transpiration.\r\n"},"2":{"name":"forest","description":"Forests include tree cover greater than 30 percent tree canopy density and greater than 5 meters in height as mapped at a 30-meter Landsat pixel scale.\r\n"},"3":{"name":"forest concession","description":"A legal agreement allowing an entity the right to manage a public forest for production purposes.\r\n"},"90":{"name":"forest concessions","description":"A legal agreement allowing an entity the right to manage a public forest for production purposes.\r\n"},"53":{"name":"forest degradation","description":"The reduction in a forest\u2019s ability to perform ecosystem services, such as carbon storage and water regulation, due to natural and anthropogenic changes.\r\n"},"54":{"name":"forest disturbance","description":"A discrete event that changes the structure of a forest ecosystem.\r\n"},"100":{"name":"forest disturbances","description":"A discrete event that changes the structure of a forest ecosystem.\r\n"},"5":{"name":"forest fragmentation","description":"The breaking of large, contiguous forests into smaller pieces, with other land cover types interspersed.\r\n"},"6":{"name":"forest management plan","description":"A plan that documents the stewardship and use of forests and other wooded land to meet environmental, economic, social, and cultural objectives. Such plans are typically implemented by companies in forest concessions.\r\n"},"62":{"name":"forests","description":"Forests include tree cover greater than 30 percent tree canopy density and greater than 5 meters in height as mapped at a 30-meter Landsat pixel scale.\r\n"},"69":{"name":"fragmentation","description":"The breaking of large, contiguous forests into smaller pieces, with other land cover types interspersed.\r\n"},"80":{"name":"fragmented","description":"The breaking of large, contiguous forests into smaller pieces, with other land cover types interspersed.\r\n"},"74":{"name":"gain","description":"The establishment of tree canopy in an area that previously had no tree cover. Tree cover gain may indicate a number of potential activities, including natural forest growth or the crop rotation cycle of tree plantations.\r\n"},"143":{"name":"global land squeeze","description":"Pressure on finite land resources to produce food, feed and fuel for a growing human population while also sustaining biodiversity and providing ecosystem services.\r\n"},"7":{"name":"hectare","description":"One hectare equals 100 square meters, 2.47 acres, or 0.01 square kilometers and is about the size of a rugby field. A football pitch is slightly smaller than a hectare (pitches are between 0.62 and 0.82 hectares).\r\n"},"66":{"name":"hectares","description":"One hectare equals 100 square meters, 2.47 acres, or 0.01 square kilometers and is about the size of a rugby field. A football pitch is slightly smaller than a hectare (pitches are between 0.62 and 0.82 hectares).\r\n"},"67":{"name":"intact","description":"A forest that contains no signs of human activity or habitat fragmentation as determined by remote sensing images and is large enough to maintain all native biological biodiversity.\r\n"},"78":{"name":"intact forest","description":"A forest that contains no signs of human activity or habitat fragmentation as determined by remote sensing images and is large enough to maintain all native biological biodiversity.\r\n"},"8":{"name":"intact forests","description":"A forest that contains no signs of human activity or habitat fragmentation as determined by remote sensing images and is large enough to maintain all native biological biodiversity.\r\n"},"55":{"name":"land and environmental defenders","description":"People who peacefully promote and protect rights related to land and\/or the environment.\r\n"},"9":{"name":"loss driver","description":"The direct cause of forest disturbance.\r\n"},"10":{"name":"low tree canopy density","description":"Less than 30 percent tree canopy density.\r\n"},"84":{"name":"managed forest concession","description":"Areas where governments have given rights to private companies to harvest timber and other wood products from natural forests on public lands.\r\n"},"83":{"name":"managed forest concession maps for nine countries","description":"Cameroon, Canada, Central African Republic, Democratic Republic of the Congo, Equatorial Guinea, Gabon, Indonesia, Liberia, and the Republic of the Congo\r\n"},"104":{"name":"managed natural forests","description":"Naturally regenerated forests with signs of management, including logging, clear cuts, etc.\r\n"},"91":{"name":"megacities","description":"A city with more than 10 million people.\r\n"},"57":{"name":"megacity","description":"A city with more than 10 million people."},"56":{"name":"mosaic restoration","description":"Restoration that integrates trees into mixed-use landscapes, such as agricultural lands and settlements, where trees can support people through improved water quality, increased soil fertility, and other ecosystem services. This type of restoration is more likely in deforested or degraded forest landscapes with moderate population density (10\u2013100 people per square kilometer). "},"86":{"name":"natural","description":"A forest that is grown without human intervention.\r\n"},"12":{"name":"natural forest","description":"A forest that is grown without human intervention.\r\n"},"63":{"name":"natural forests","description":"A forest that is grown without human intervention.\r\n"},"144":{"name":"open canopy systems","description":"Individual tree crowns that do not overlap to form a continuous canopy layer.\r\n"},"82":{"name":"persistent gain","description":"Forests that have experienced one gain event from 2001 to 2016.\r\n"},"13":{"name":"persistent loss and gain","description":"Forests that have experienced one loss or one gain event from 2001 to 2016."},"97":{"name":"plantation","description":"An area in which trees have been planted, generally for commercial purposes.\u0026nbsp;\r\n"},"93":{"name":"plantations","description":"An area in which trees have been planted, generally for commercial purposes.\u0026nbsp;\r\n"},"88":{"name":"planted","description":"A forest composed of trees that have been deliberately planted and\/or seeded by humans.\r\n"},"14":{"name":"planted forest","description":"Stand of planted trees \u2014 other than tree crops \u2014 grown for wood and wood fiber production or for ecosystem protection against wind and\/or soil erosion.\r\n"},"73":{"name":"planted forests","description":"Stand of planted trees \u2014 other than tree crops \u2014 grown for wood and wood fiber production or for ecosystem protection against wind and\/or soil erosion."},"148":{"name":"planted trees","description":"Stand of trees established through planting, including both planted forest and tree crops."},"149":{"name":"Planted trees","description":"Stand of trees established through planting, including both planted forest and tree crops."},"15":{"name":"primary forest","description":"Old-growth forests that are typically high in carbon stock and rich in biodiversity. The GFR uses a humid tropical primary rainforest data set, representing forests in the humid tropics that have not been cleared in recent years.\r\n"},"64":{"name":"primary forests","description":"Old-growth forests that are typically high in carbon stock and rich in biodiversity. The GFR uses a humid tropical primary rainforest data set, representing forests in the humid tropics that have not been cleared in recent years.\r\n"},"58":{"name":"production forest","description":"A forest where the primary management objective is to produce timber, pulp, fuelwood, and\/or nonwood forest products."},"89":{"name":"production forests","description":"A forest where the primary management objective is to produce timber, pulp, fuelwood, and\/or nonwood forest products.\r\n"},"87":{"name":"seminatural","description":"A managed forest modified by humans, which can have a different species composition from surrounding natural forests.\r\n"},"59":{"name":"seminatural forests","description":"A managed forest modified by humans, which can have a different species composition from surrounding natural forests. "},"96":{"name":"shifting agriculture","description":"Temporary loss or permanent deforestation due to small- and medium-scale agriculture.\r\n"},"103":{"name":"surface roughness","description":"Surface roughness of forests creates\u0026nbsp;turbulence that slows near-surface winds and cools the land as it lifts heat from low-albedo leaves and moisture from evapotranspiration high into the atmosphere and slows otherwise-drying winds. \r\n"},"17":{"name":"tree cover","description":"All vegetation greater than five meters in height and may take the form of natural forests or plantations across a range of canopy densities. Unless otherwise specified, the GFR uses greater than 30 percent tree canopy density for calculations.\r\n"},"71":{"name":"tree cover canopy density is low","description":"Less than 30 percent tree canopy density.\r\n"},"60":{"name":"tree cover gain","description":"The establishment of tree canopy in an area that previously had no tree cover. Tree cover gain may indicate a number of potential activities, including natural forest growth or the crop rotation cycle of tree plantations.\u0026nbsp;As such, tree cover gain does not equate to restoration.\r\n"},"18":{"name":"tree cover loss","description":"The removal or mortality of tree cover, which can be due to a variety of factors, including mechanical harvesting, fire, disease, or storm damage. As such, loss does not equate to deforestation.\r\n"},"150":{"name":"tree crops","description":"Stand of perennial trees that produce agricultural products, such as rubber, oil palm, coffee, coconut, cocoa and orchards."},"19":{"name":"tree plantation","description":"An agricultural plantation of fast-growing tree species on short rotations for the production of timber, pulp, or fruit.\r\n"},"72":{"name":"tree plantations","description":"An agricultural plantation of fast-growing tree species on short rotations for the production of timber, pulp, or fruit.\r\n"},"85":{"name":"trees outside forests","description":"Trees found in urban areas, alongside roads, or within agricultural land\u0026nbsp;are often referred to as Trees Outside Forests (TOF).\u202f\r\n"},"151":{"name":"unmanaged","description":"Naturally regenerated forests without any signs of management, including primary forest."},"105":{"name":"unmanaged natural forests","description":"Naturally regenerated forests without any signs of management, including primary forest.\r\n"}}}
The Complete Menu: Creating a Sustainable Food Future (Synthesis)
-
The individual menu items presented in Courses 1–5 can each contribute to meeting global targets for increasing food production, minimizing expansion of agricultural land area, and reducing GHG emissions. In this section, we use the GlobAgri-WRR model to examine some plausible (or at least possible) combinations of menu items and analyze how they could close the three gaps and achieve a sustainable food future.
To assess the potential of the full menu to close the food, land, and GHG mitigation gaps, we constructed three combination scenarios that reflect ascending levels of ambition (Table 3). They are guided by the following criteria:
- Coordinated Effort Scenario. Menu items involve measures we are confident the world could achieve with a strong, coordinated, global commitment to action. The economic costs would be limited or even positive. No fundamental breakthroughs in technology would be required.
- Highly Ambitious Scenario. Menu items involve measures at the outer range of what might be technically achieved either with existing technology or with realistic improvements to existing technology. Costs would likely be higher.
- Breakthrough Technologies Scenario. Measures from the Highly Ambitious scenario plus those that could be achieved with technological breakthroughs in fields where science has shown significant progress.
The size of the gap closure contributed by each menu item does not necessarily reflect the return per unit of effort. It is more a measure of the definitional scope of each menu item. For example, large reductions in food loss and waste (affecting 24 percent of global calorie production) will, by definition, contribute more than improving productivity of aquaculture, which only affects 1 percent of global calorie consumption.
Table 3
The GlobAgri-WRR 2050 baseline projection and three combination scenarios

Quantitative results of the three combination scenarios are presented in Table 4. The contributions of specific menu items are shown in Figures 21–23 for the Breakthrough Technologies scenario only. For each menu item, its contribution in the combined scenarios is smaller than its “standalone” contribution due to interaction between menu items (e.g., land “savings” attributed to food waste reductions are smaller if those reductions happen simultaneously with additional crop yield growth).
All three scenarios substantially reduce the food gap by reducing the rate of growth in demand for food. The challenge of increasing crop production by 56 percent between 2010 and 2050 (baseline) is reduced to 43 percent, 35 percent, and 29 percent in the three scenarios, respectively.
The Coordinated Effort scenario reduces agricultural land expansion between 2010 and 2050 by 78 percent. The Highly Ambitious and Breakthrough Technologies scenarios completely close the land gap and create the opportunity for significant reforestation on liberated agricultural land.
The hardest gap to close is the GHG mitigation gap because it is difficult to reduce annual agricultural production emissions to the 4 Gt CO2e target while feeding everyone in 2050. Annual production emissions remain at 4.4 Gt even in our Breakthrough Technologies scenario (Figure 23). Reaching the 4 Gt goal would require major technological advances as well as full reforestation on at least 80 Mha of liberated agricultural land.
Furthermore, other analyses have suggested that to meet the more ambitious 1.5°C warming target in the Paris Agreement,98 CO2e the world will need to use large quantities of land to offset other sources of emissions. In our Breakthrough Technologies scenario, it might be possible to liberate 585 Mha of agricultural land—after accounting for some expansion of timber plantations and human settlements—which, if fully reforested, could offset around 4 Gt of emissions per year for many years.
Plausible pathways toward a sustainable food future exist, but they will require strong and almost universal political and social effort. Achieving even our Coordinated Effort scenario requires reversing a wide range of current trends. Truly realizing the environmental benefits from food demand reductions and crop and livestock yield gains also depends on policies that greatly reduce agricultural land-shifting and protect forests and other natural areas.
Table 4
Global effects of 2050 combination scenarios on the three gaps, agricultural land use, and greenhouse gas emissions

Notes
Numbers may not sum correctly due to rounding. Under the Highly Ambitious and Breakthrough Technologies scenarios, 0.3 Gt CO2e of ongoing peatland emissions remain, but total agricultural area declines between 2010 and 2050. We discuss the need to reforest “liberated” agricultural lands to offset agricultural production emissions on page 59.
Source
GlobAgri-WRR model.
We conclude that three categories of menu items are particularly important at the global level:
- Boosting productivity. The Coordinated Effort scenario requires faster rates of crop yield growth than historical rates since the 1960s. Recent yield trend lines (since the 1980s) are actually slower than those in our baseline, and far from the additional yield gains required. Ruminant meat and milk yield gains in the Coordinated Effort scenario require massive increases in output per hectare of pastureland—far greater than the output gains projected by extending a linear trend from the 1960s.
- Shifting diets to reduce demand for ruminant meat. A reduction in ruminant meat consumption by 30 percent relative to our 2050 baseline—which still results in a 32 percent increase above 2010 levels—plays a major role in closing the land and GHG mitigation gaps. We consider it eminently practicable, but the cultural and behavioral changes required will be challenging.
- Reducing food loss and waste. Globally reducing the rate of food loss and waste by 10, 25, or 50 percent would significantly close all three gaps. However, there is little precedent for achieving such large-scale reductions—particularly because as countries’ economies develop, food waste near the consumption side of the food supply chain tends to grow even as food loss near the production side decreases.
Figure 21
Under the Breakthrough Technologies scenario, the amount of additional food needed to feed the world in 2050 could be cut by half
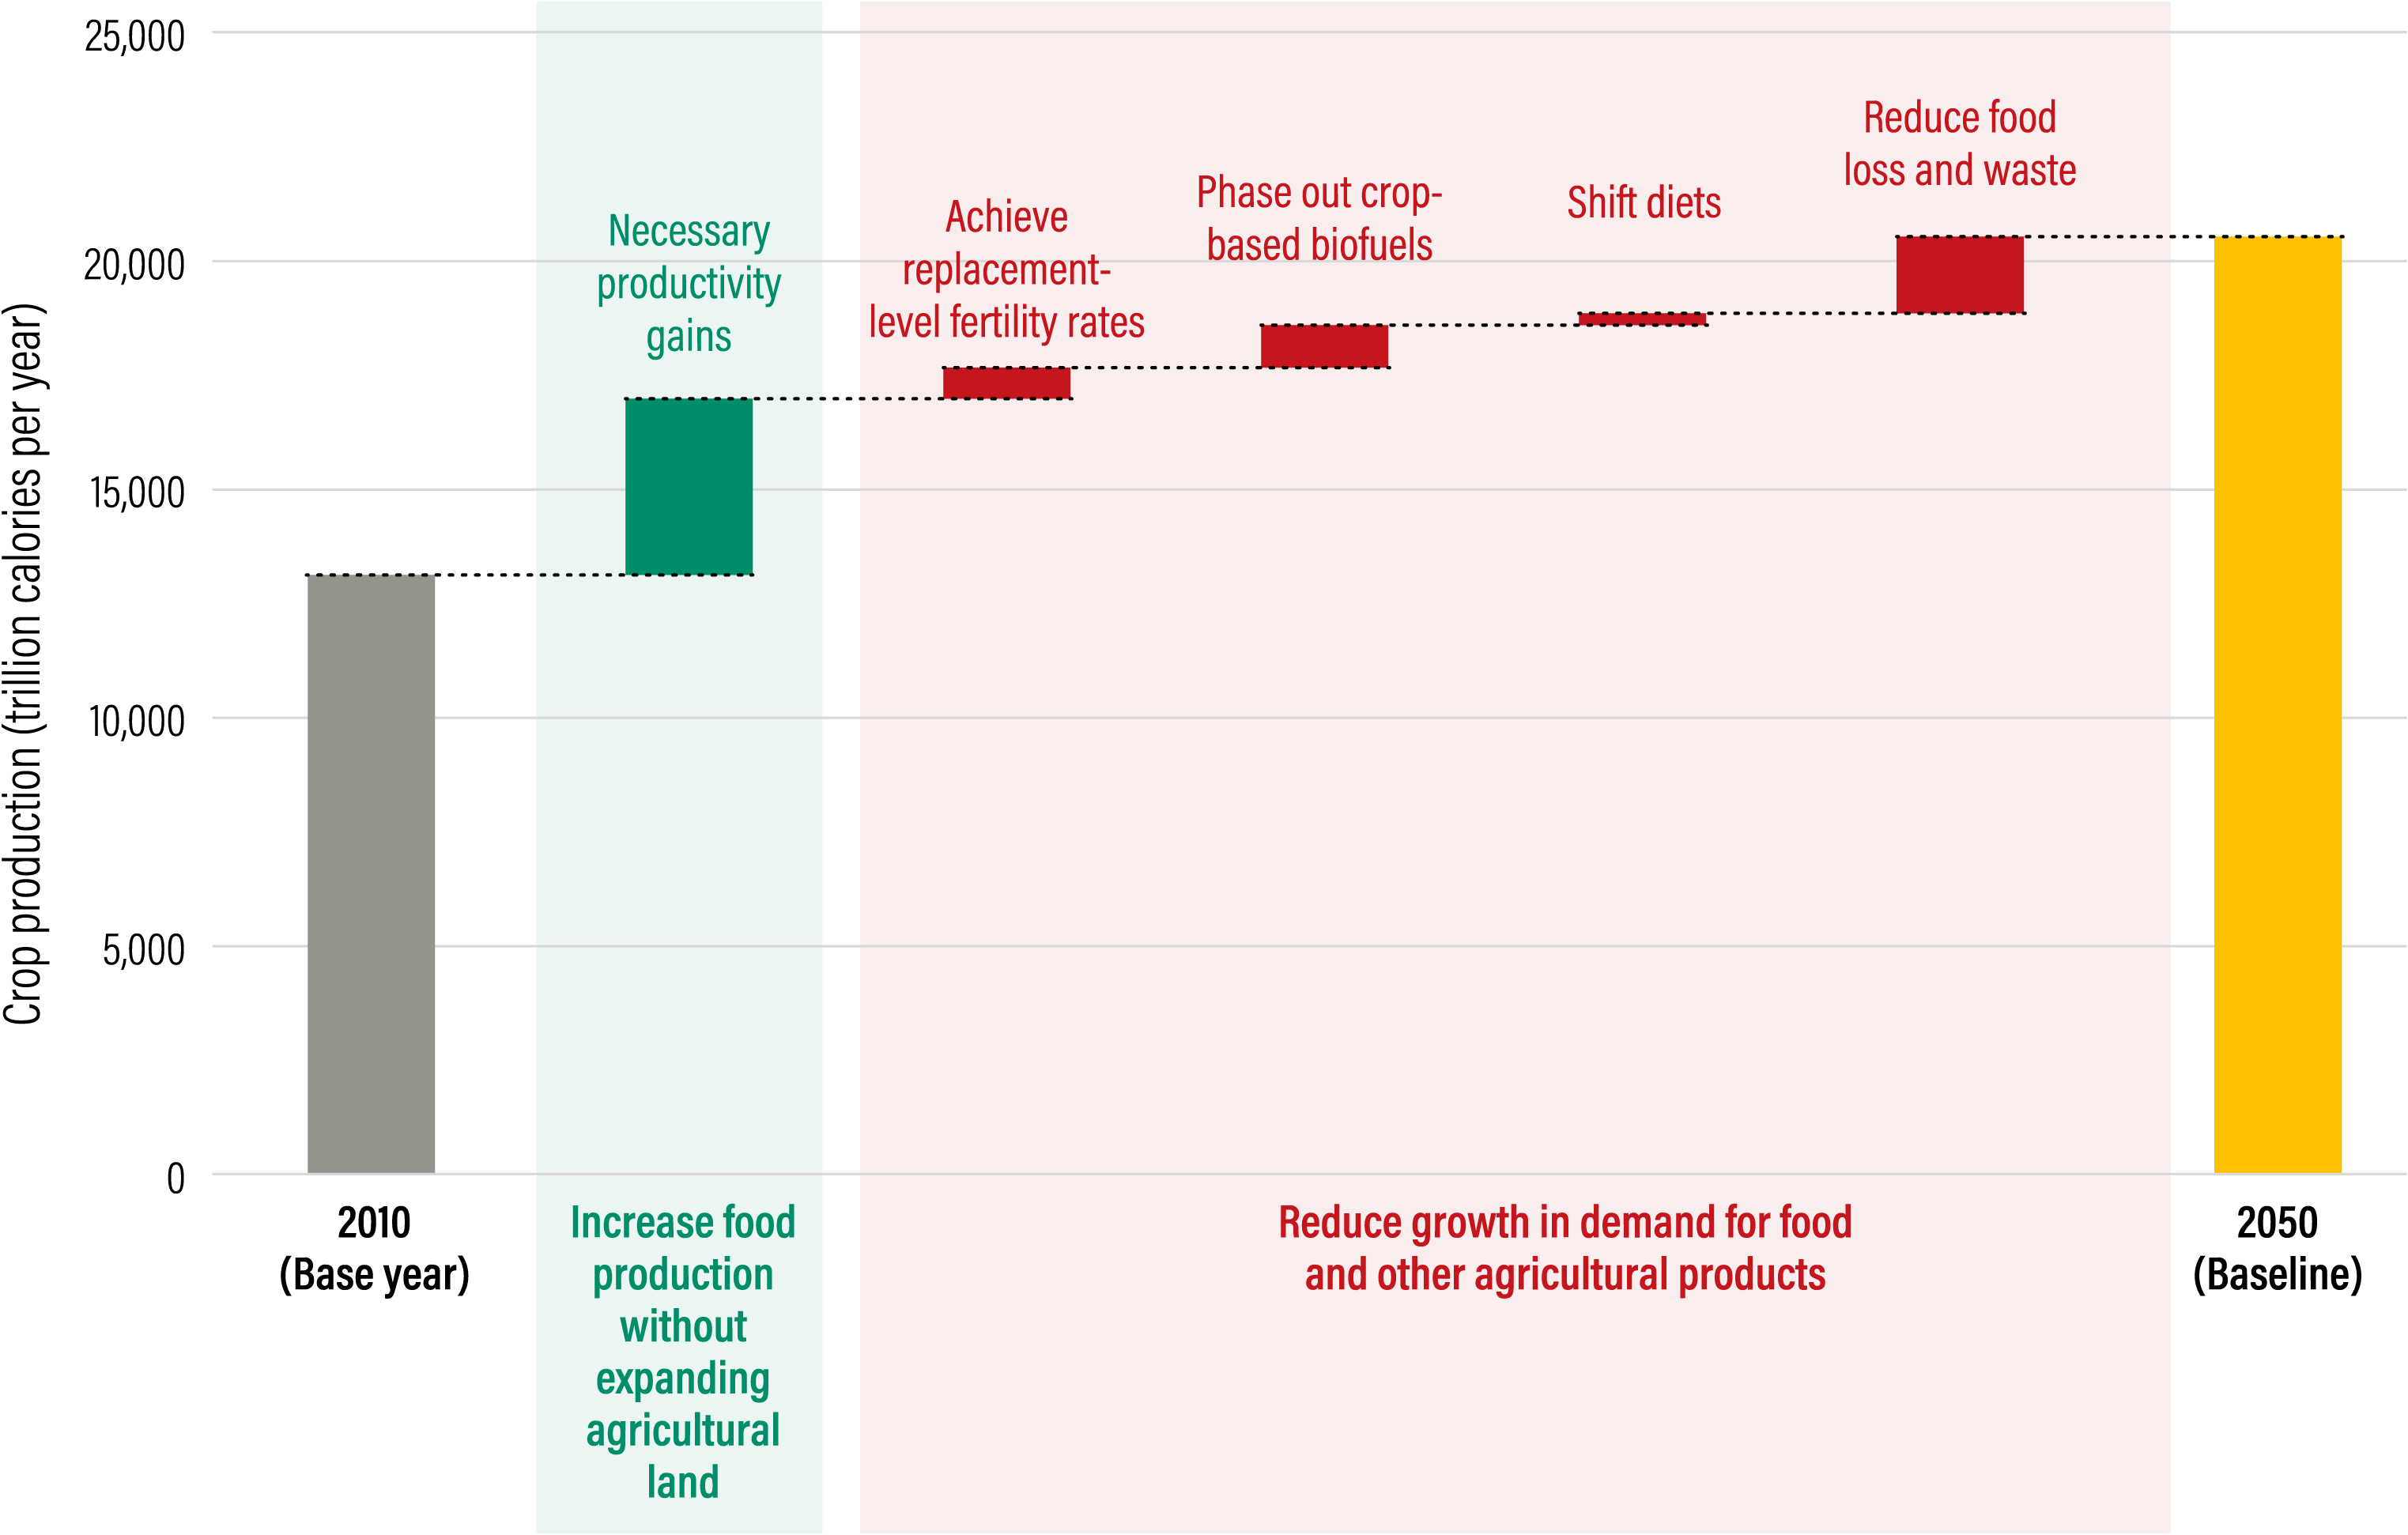
Note
Includes all crops intended for direct human consumption, animal feed, industrial uses, seeds, and biofuels.
Source
GlobAgri-WRR model.
Figure 22
Under the Breakthrough Technologies scenario, the area of land needed for agriculture could shrink by 800 million hectares, which would be liberated for reforestation

Source
GlobAgri-WRR model.
Figure 23
Under the Breakthrough Technologies scenario, agricultural greenhouse gas emissions would fall dramatically but reforestation and peatland restoration would be necessary to meet the target of 4 gigatons per year
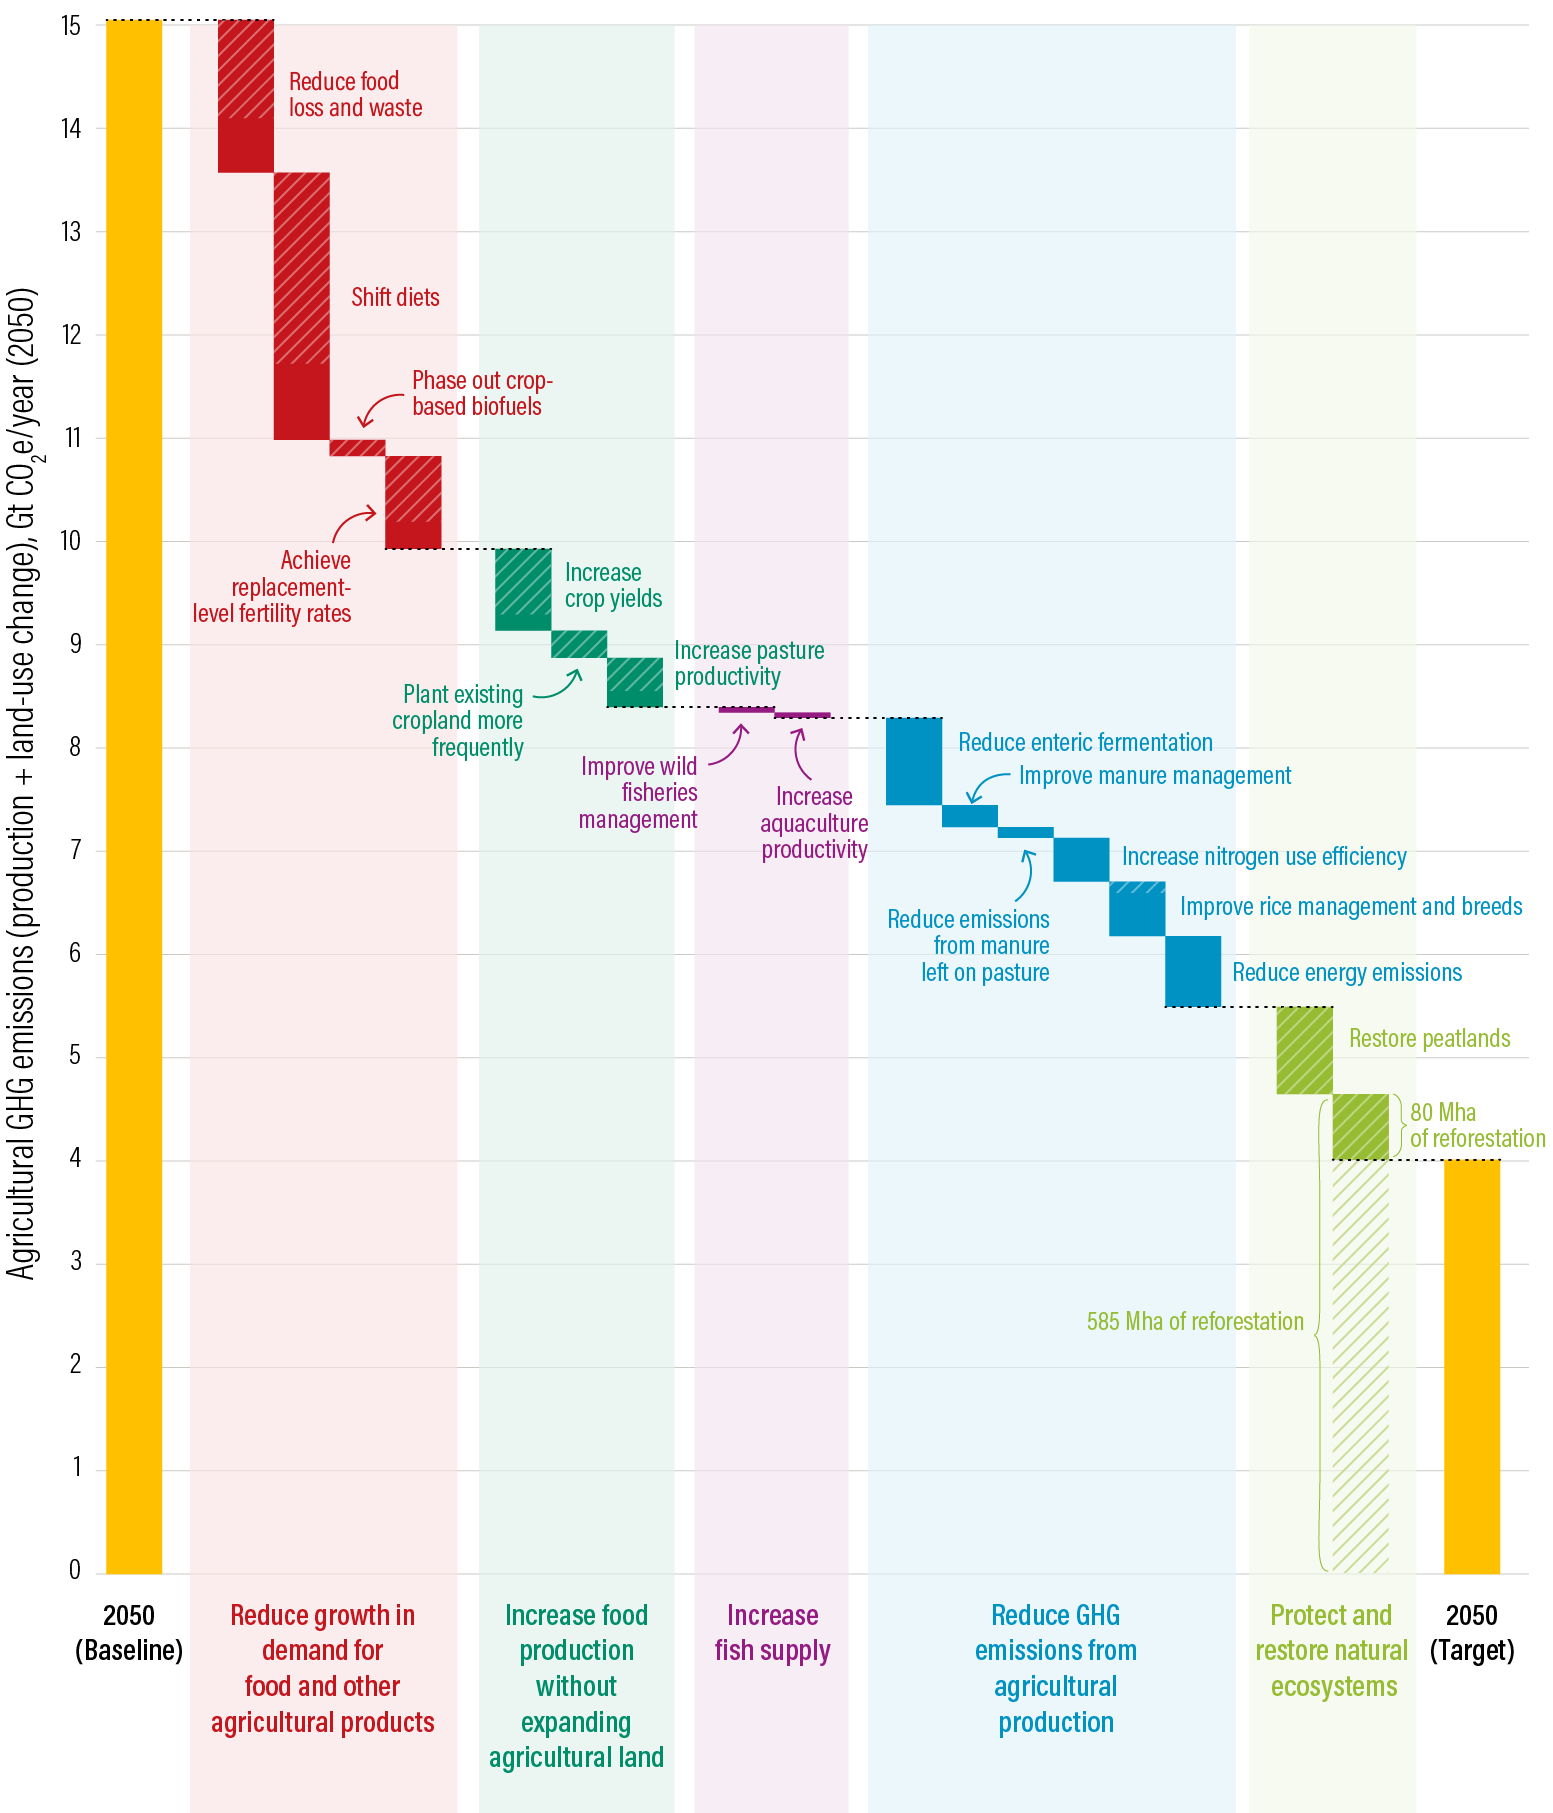
Note
Solid areas represent agricultural production emissions. Hatched areas represent emissions from land-use change.
Source
GlobAgri-WRR model.
Endnotes
- 98Lowder et al. (2016).