Course 2: Increase Food Production without Expanding Agricultural Land (Synthesis)
{"Glossary":{"51":{"name":"agricultural tree crops","description":"Trees cultivated for their food, cultural, or economic values. These include oil palm, rubber, cocoa, cashew, mango, oranges (citrus), plantain, banana, and coconut.\r\n"},"141":{"name":"agroforestry","description":"A diversified set of agricultural or agropastoral production systems that integrate trees in the agricultural landscape.\r\n"},"101":{"name":"albedo","description":"The ability of surfaces to reflect sunlight.\u0026nbsp;Light-colored surfaces return a large part of the sunrays back to the atmosphere (high albedo). Dark surfaces absorb the rays from the sun (low albedo).\r\n"},"94":{"name":"biodiversity intactness","description":"The proportion and abundance of a location\u0027s original forest community (number of species and individuals) that remain.\u0026nbsp;\r\n"},"95":{"name":"biodiversity significance","description":"The importance of an area for the persistence of forest-dependent species based on range rarity.\r\n"},"142":{"name":"boundary plantings","description":"Trees planted along boundaries or property lines to mark them well.\r\n"},"98":{"name":"carbon dioxide equivalent (CO2e)","description":"Carbon dioxide equivalent (CO2e) is a measure used to aggregate emissions from various greenhouse gases (GHGs) on the basis of their 100-year global warming potentials by equating non-CO2 GHGs to the equivalent amount of CO2.\r\n"},"99":{"name":"CO2e","description":"Carbon dioxide equivalent (CO2e) is a measure used to aggregate emissions from various greenhouse gases (GHGs) on the basis of their 100-year global warming potentials by equating non-CO2 GHGs to the equivalent amount of CO2.\r\n"},"1":{"name":"deforestation","description":"The change from forest to another land cover or land use, such as forest to plantation or forest to urban area.\r\n"},"77":{"name":"deforested","description":"The change from forest to another land cover or land use, such as forest to plantation or forest to urban area.\r\n"},"76":{"name":"degradation","description":"The reduction in a forest\u2019s ability to perform ecosystem services, such as carbon storage and water regulation, due to natural and anthropogenic changes.\r\n"},"75":{"name":"degraded","description":"The reduction in a forest\u2019s ability to perform ecosystem services, such as carbon storage and water regulation, due to natural and anthropogenic changes.\r\n"},"79":{"name":"disturbances","description":"A discrete event that changes the structure of a forest ecosystem.\r\n"},"68":{"name":"disturbed","description":"A discrete event that changes the structure of a forest ecosystem.\r\n"},"65":{"name":"driver of tree cover loss","description":"The direct cause of forest disturbance.\r\n"},"70":{"name":"drivers of loss","description":"The direct cause of forest disturbance.\r\n"},"81":{"name":"drivers of tree cover loss","description":"The direct cause of forest disturbance.\r\n"},"102":{"name":"evapotranspiration","description":"When solar energy hitting a forest converts liquid water into water vapor (carrying energy as latent heat) through evaporation and transpiration.\r\n"},"2":{"name":"forest","description":"Forests include tree cover greater than 30 percent tree canopy density and greater than 5 meters in height as mapped at a 30-meter Landsat pixel scale.\r\n"},"3":{"name":"forest concession","description":"A legal agreement allowing an entity the right to manage a public forest for production purposes.\r\n"},"90":{"name":"forest concessions","description":"A legal agreement allowing an entity the right to manage a public forest for production purposes.\r\n"},"53":{"name":"forest degradation","description":"The reduction in a forest\u2019s ability to perform ecosystem services, such as carbon storage and water regulation, due to natural and anthropogenic changes.\r\n"},"54":{"name":"forest disturbance","description":"A discrete event that changes the structure of a forest ecosystem.\r\n"},"100":{"name":"forest disturbances","description":"A discrete event that changes the structure of a forest ecosystem.\r\n"},"5":{"name":"forest fragmentation","description":"The breaking of large, contiguous forests into smaller pieces, with other land cover types interspersed.\r\n"},"6":{"name":"forest management plan","description":"A plan that documents the stewardship and use of forests and other wooded land to meet environmental, economic, social, and cultural objectives. Such plans are typically implemented by companies in forest concessions.\r\n"},"62":{"name":"forests","description":"Forests include tree cover greater than 30 percent tree canopy density and greater than 5 meters in height as mapped at a 30-meter Landsat pixel scale.\r\n"},"69":{"name":"fragmentation","description":"The breaking of large, contiguous forests into smaller pieces, with other land cover types interspersed.\r\n"},"80":{"name":"fragmented","description":"The breaking of large, contiguous forests into smaller pieces, with other land cover types interspersed.\r\n"},"74":{"name":"gain","description":"The establishment of tree canopy in an area that previously had no tree cover. Tree cover gain may indicate a number of potential activities, including natural forest growth or the crop rotation cycle of tree plantations.\r\n"},"143":{"name":"global land squeeze","description":"Pressure on finite land resources to produce food, feed and fuel for a growing human population while also sustaining biodiversity and providing ecosystem services.\r\n"},"7":{"name":"hectare","description":"One hectare equals 100 square meters, 2.47 acres, or 0.01 square kilometers and is about the size of a rugby field. A football pitch is slightly smaller than a hectare (pitches are between 0.62 and 0.82 hectares).\r\n"},"66":{"name":"hectares","description":"One hectare equals 100 square meters, 2.47 acres, or 0.01 square kilometers and is about the size of a rugby field. A football pitch is slightly smaller than a hectare (pitches are between 0.62 and 0.82 hectares).\r\n"},"67":{"name":"intact","description":"A forest that contains no signs of human activity or habitat fragmentation as determined by remote sensing images and is large enough to maintain all native biological biodiversity.\r\n"},"78":{"name":"intact forest","description":"A forest that contains no signs of human activity or habitat fragmentation as determined by remote sensing images and is large enough to maintain all native biological biodiversity.\r\n"},"8":{"name":"intact forests","description":"A forest that contains no signs of human activity or habitat fragmentation as determined by remote sensing images and is large enough to maintain all native biological biodiversity.\r\n"},"55":{"name":"land and environmental defenders","description":"People who peacefully promote and protect rights related to land and\/or the environment.\r\n"},"9":{"name":"loss driver","description":"The direct cause of forest disturbance.\r\n"},"10":{"name":"low tree canopy density","description":"Less than 30 percent tree canopy density.\r\n"},"84":{"name":"managed forest concession","description":"Areas where governments have given rights to private companies to harvest timber and other wood products from natural forests on public lands.\r\n"},"83":{"name":"managed forest concession maps for nine countries","description":"Cameroon, Canada, Central African Republic, Democratic Republic of the Congo, Equatorial Guinea, Gabon, Indonesia, Liberia, and the Republic of the Congo\r\n"},"104":{"name":"managed natural forests","description":"Naturally regenerated forests with signs of management, including logging, clear cuts, etc.\r\n"},"91":{"name":"megacities","description":"A city with more than 10 million people.\r\n"},"57":{"name":"megacity","description":"A city with more than 10 million people."},"56":{"name":"mosaic restoration","description":"Restoration that integrates trees into mixed-use landscapes, such as agricultural lands and settlements, where trees can support people through improved water quality, increased soil fertility, and other ecosystem services. This type of restoration is more likely in deforested or degraded forest landscapes with moderate population density (10\u2013100 people per square kilometer). "},"86":{"name":"natural","description":"A forest that is grown without human intervention.\r\n"},"12":{"name":"natural forest","description":"A forest that is grown without human intervention.\r\n"},"63":{"name":"natural forests","description":"A forest that is grown without human intervention.\r\n"},"144":{"name":"open canopy systems","description":"Individual tree crowns that do not overlap to form a continuous canopy layer.\r\n"},"82":{"name":"persistent gain","description":"Forests that have experienced one gain event from 2001 to 2016.\r\n"},"13":{"name":"persistent loss and gain","description":"Forests that have experienced one loss or one gain event from 2001 to 2016."},"97":{"name":"plantation","description":"An area in which trees have been planted, generally for commercial purposes.\u0026nbsp;\r\n"},"93":{"name":"plantations","description":"An area in which trees have been planted, generally for commercial purposes.\u0026nbsp;\r\n"},"88":{"name":"planted","description":"A forest composed of trees that have been deliberately planted and\/or seeded by humans.\r\n"},"14":{"name":"planted forest","description":"Stand of planted trees \u2014 other than tree crops \u2014 grown for wood and wood fiber production or for ecosystem protection against wind and\/or soil erosion.\r\n"},"73":{"name":"planted forests","description":"Stand of planted trees \u2014 other than tree crops \u2014 grown for wood and wood fiber production or for ecosystem protection against wind and\/or soil erosion."},"148":{"name":"planted trees","description":"Stand of trees established through planting, including both planted forest and tree crops."},"149":{"name":"Planted trees","description":"Stand of trees established through planting, including both planted forest and tree crops."},"15":{"name":"primary forest","description":"Old-growth forests that are typically high in carbon stock and rich in biodiversity. The GFR uses a humid tropical primary rainforest data set, representing forests in the humid tropics that have not been cleared in recent years.\r\n"},"64":{"name":"primary forests","description":"Old-growth forests that are typically high in carbon stock and rich in biodiversity. The GFR uses a humid tropical primary rainforest data set, representing forests in the humid tropics that have not been cleared in recent years.\r\n"},"58":{"name":"production forest","description":"A forest where the primary management objective is to produce timber, pulp, fuelwood, and\/or nonwood forest products."},"89":{"name":"production forests","description":"A forest where the primary management objective is to produce timber, pulp, fuelwood, and\/or nonwood forest products.\r\n"},"87":{"name":"seminatural","description":"A managed forest modified by humans, which can have a different species composition from surrounding natural forests.\r\n"},"59":{"name":"seminatural forests","description":"A managed forest modified by humans, which can have a different species composition from surrounding natural forests. "},"96":{"name":"shifting agriculture","description":"Temporary loss or permanent deforestation due to small- and medium-scale agriculture.\r\n"},"103":{"name":"surface roughness","description":"Surface roughness of forests creates\u0026nbsp;turbulence that slows near-surface winds and cools the land as it lifts heat from low-albedo leaves and moisture from evapotranspiration high into the atmosphere and slows otherwise-drying winds. \r\n"},"17":{"name":"tree cover","description":"All vegetation greater than five meters in height and may take the form of natural forests or plantations across a range of canopy densities. Unless otherwise specified, the GFR uses greater than 30 percent tree canopy density for calculations.\r\n"},"71":{"name":"tree cover canopy density is low","description":"Less than 30 percent tree canopy density.\r\n"},"60":{"name":"tree cover gain","description":"The establishment of tree canopy in an area that previously had no tree cover. Tree cover gain may indicate a number of potential activities, including natural forest growth or the crop rotation cycle of tree plantations.\u0026nbsp;As such, tree cover gain does not equate to restoration.\r\n"},"18":{"name":"tree cover loss","description":"The removal or mortality of tree cover, which can be due to a variety of factors, including mechanical harvesting, fire, disease, or storm damage. As such, loss does not equate to deforestation.\r\n"},"150":{"name":"tree crops","description":"Stand of perennial trees that produce agricultural products, such as rubber, oil palm, coffee, coconut, cocoa and orchards."},"19":{"name":"tree plantation","description":"An agricultural plantation of fast-growing tree species on short rotations for the production of timber, pulp, or fruit.\r\n"},"72":{"name":"tree plantations","description":"An agricultural plantation of fast-growing tree species on short rotations for the production of timber, pulp, or fruit.\r\n"},"85":{"name":"trees outside forests","description":"Trees found in urban areas, alongside roads, or within agricultural land\u0026nbsp;are often referred to as Trees Outside Forests (TOF).\u202f\r\n"},"151":{"name":"unmanaged","description":"Naturally regenerated forests without any signs of management, including primary forest."},"105":{"name":"unmanaged natural forests","description":"Naturally regenerated forests without any signs of management, including primary forest.\r\n"}}}
Course 2
Increase Food Production without Expanding Agricultural Land (Synthesis)
In addition to the demand-reduction measures addressed in Course 1, the world must boost the output of food on existing agricultural land. To approach the goal of net-zero expansion of agricultural land, under realistic scenarios, improvements in crop and pasture productivity must exceed historical rates of yield gains.
Assessing the Challenge of Agricultural Land Expansion
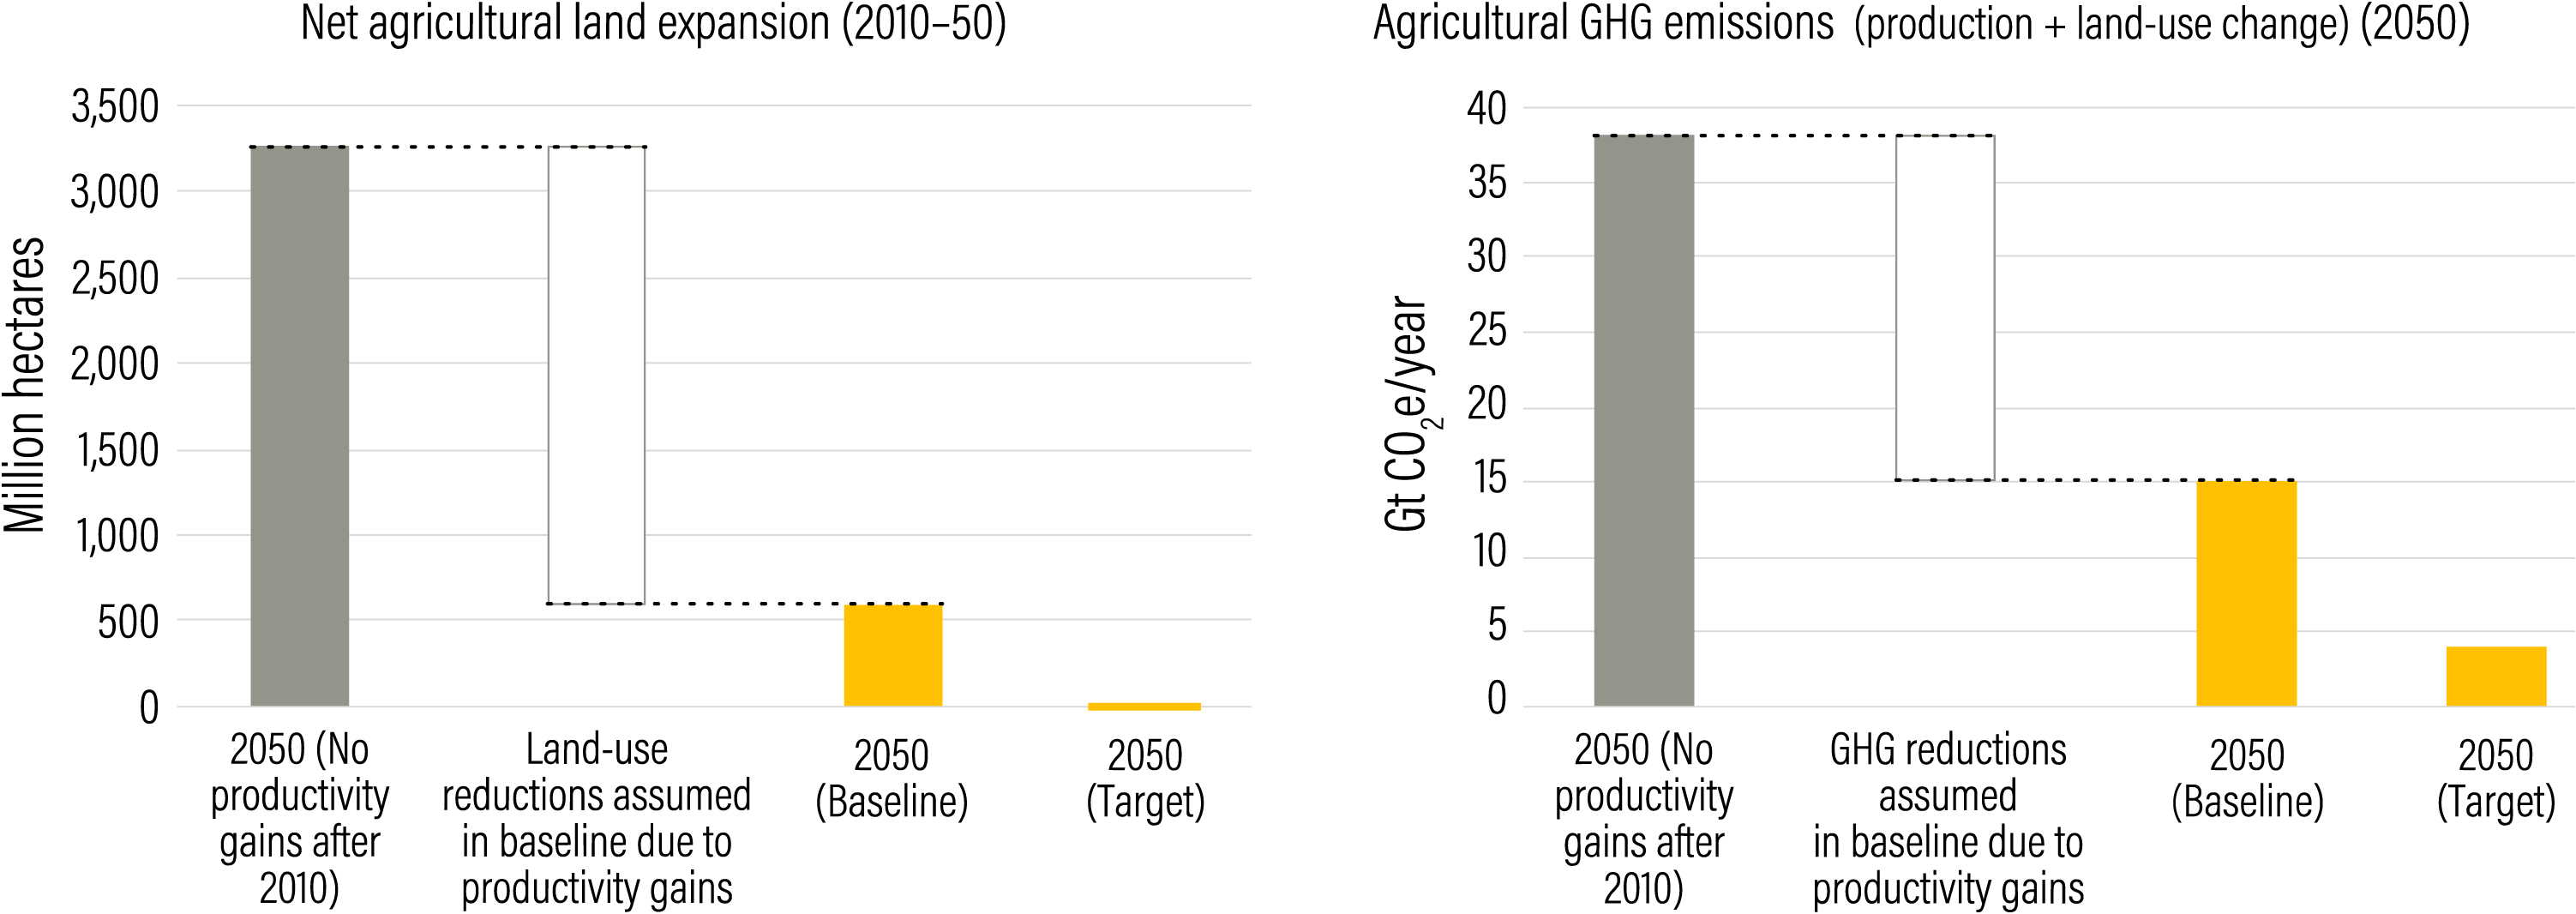
The single most important need for a sustainable food future is boosting the natural resource efficiency of agriculture, that is, producing more food per hectare, per animal, per kilogram of fertilizer, and per liter of water. Such productivity gains reduce both the need for additional land and the emissions from production processes. Without the large crop and livestock productivity gains built into our baseline (based roughly on trends since 1961), land conversion would be five times greater by 2050 and GHG emissions would be more than double the level projected in our baseline (Figure 9).
In some mitigation analyses, including reports by the Intergovernmental Panel on Climate Change (IPCC), agricultural productivity gains are barely mentioned, for reasons that are unclear. Even under our baseline projection, with its large increases in crop and livestock yields, we project that agricultural land will expand by 593 Mha to meet expected food demand. Unless projected growth in demand for food can be moderated, to avoid land expansion both crop yields and pasture-raised livestock yields will have to grow even faster between 2010 and 2050 than they grew in previous decades.
Arguments can be made for both pessimism and optimism:
- Studies have projected that farmers could achieve far higher yields than they do today. However, methods for estimating these “yield gaps” tend to exaggerate gap sizes and farmers can rarely achieve more than 80 percent of yield potential. The most comprehensive study suggests that fully closing realistic yield gaps is unlikely to be enough to meet all food needs.
- The massive yield gains of the 50 years from 1960 to 2010 were achieved in large part by doubling irrigated area and extending the use of scientifically bred seeds and commercial fertilizer to most of the world. Only limited further expansion of these technologies remains possible.
- Optimistically, farmers have so far continued to steadily boost yields by farming smarter in a variety of ways, and new technologies are opening up new potential.
Whatever the degree of optimism, the policy implications are the same: Going forward, the world needs to make even greater efforts to boost productivity than in the past to achieve a sustainable food future.
Figure 9
Improvements in crop and livestock productivity already built into the 2050 baseline close most of the land and GHG mitigation gaps that would otherwise exist without any productivity gains after 2010

Source
GlobAgri-WRR model.
-
Demand for milk and meat from grazing ruminants is likely to grow even more than demand for crops. Because pasture makes up two-thirds of all agricultural land, the productivity of livestock will critically affect future land use and emissions. Large productivity improvements for pork and poultry are unlikely in developed countries because of biological limits.33 In developing countries, because traditional backyard systems make use of waste and scavenging, shifts to modern systems increase output but do not reduce land-use demands and emissions.
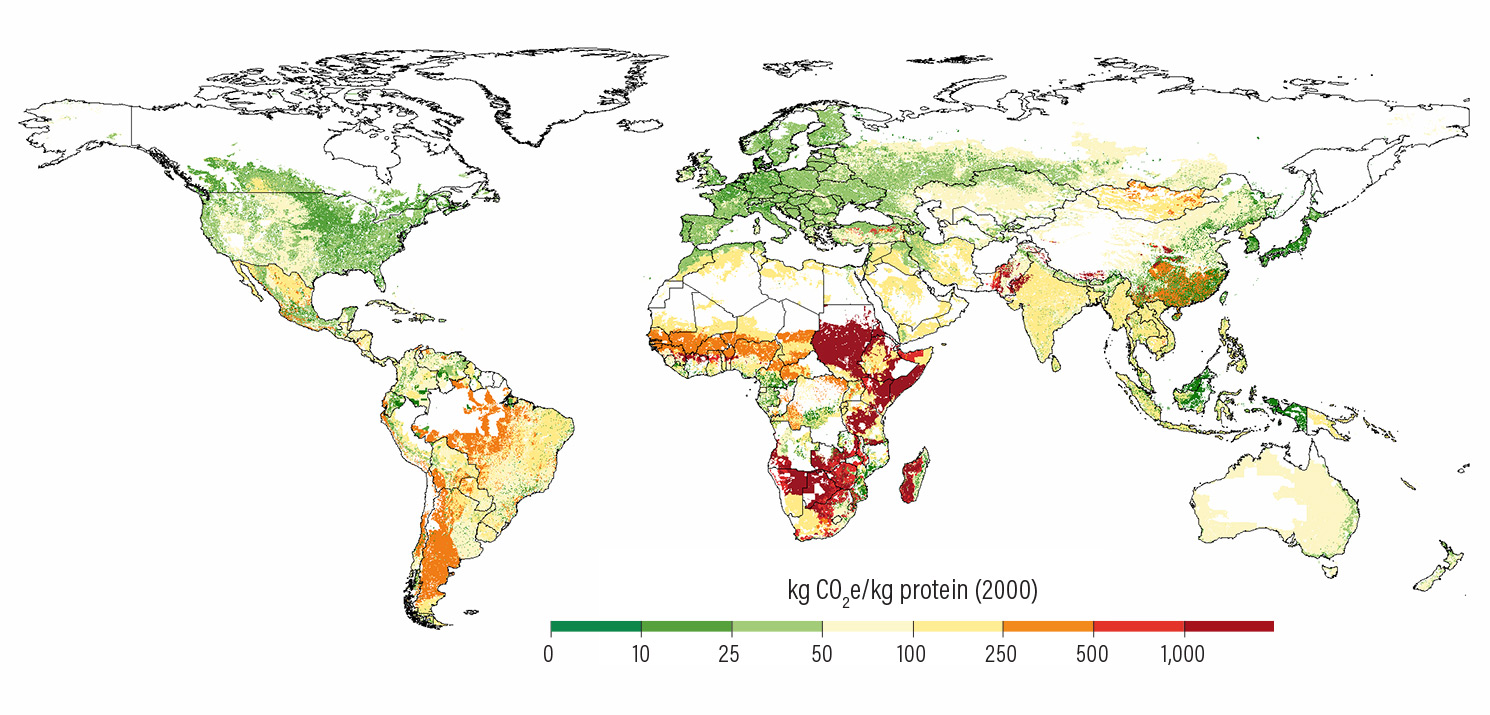
By contrast, ruminant systems have greater potential to improve, as suggested by the wide range in productivities across countries. The GHG emissions that result from producing each kilogram of beef—a good proxy for all aspects of productivity—are far higher in some countries than in others (Figure 10). Land-use requirements can be 100 times greater,34 and the quantity of feed 20 times greater.35
Higher ruminant productivity can be achieved by increasing output per animal through improved food quality, breeding, and health care; and by increasing feed output per hectare. Neither requires a shift to feedlots. On pastures with good rainfall, productivity can be increased by proper fertilization, growing legumes, rotational grazing, and adding supplemental feeds in dry seasons and during the last few months of “finishing.” In the “cut and carry” systems that predominate in Africa and Asia, farmers can grow a wide variety of improved forage grasses and shrubs with high protein leaves.
The real challenge lies in the scale of improvement required. Because much grazing land is too dry or too sloped to support large feed improvements, almost every hectare of wetter, accessible, and environmentally appropriate land would need to achieve close to its maximum productive potential to meet expected global demand without the need for further land conversion.
- Most ruminant farmers need to shift from low-management operations, which take advantage of cheap land, toward careful, intensive grazing and forage management using more labor and inputs.
- Governments in developing countries, which are home to the great majority of ruminants, should establish livestock productivity targets and support them with greater financial and technical assistance.
- Implementation of systems to analyze improvement potential and track changes in different areas and on different types of farms would help guide these investments and monitor their effects.
Figure 10
Inefficient beef production systems result in far higher greenhouse gas emissions per unit of meat output
Source
Herrero et al. (2013).
-
The global impacts of climate change on agriculture are sufficiently uncertain that we did not attempt to model them in our 2050 baseline. Although earlier analyses suggested that effects on crop yields by 2050 might even be beneficial, by the time of the 2014 IPCC report, models projected on average that, without adaptation, global crop yields were “more likely than not” to decline by at least 5 percent by 2050—with even steeper declines by 2100.47
Many estimates are even larger, and uncertainty should be a cause for greater concern because “medium” impacts are not more likely.48 We modeled one plausible estimate of a 10 percent decline in crop yields due to climate change without adaptation. Cropland would need to expand overall by 457 Mha (increasing the total land gap by 45 percent).
Climate change will benefit some crops, at least in the short term, as higher concentrations of carbon dioxide increase the efficiency of photosynthesis. Warmer temperatures will extend the growing season in colder countries and regional shifts in rainfall patterns will make some locations wetter.49 But some areas will also become drier and hotter. Higher temperatures will harm crops by drying soils, accelerating water loss, and increasing pest damage.50 Extreme heat events will harm maize, wheat, coffee, and many other crops by interfering with reproduction.51 Growing seasons in parts of sub-Saharan Africa could become too short or too irregular to support crops (Figure 11), contributing to major food security concerns.52
The evidence from crop models indicates significant but uncertain capacity to adapt using tailored crop varieties. Uncertainties about local climate change suggest broad “no regrets” strategies, many of them already included in our other menu items. For example, closing yield gaps in Africa and India would increase incomes and provide a buffer against adverse climate impacts, forest protection could increase resilience through improved local hydrology, while safety net programs for the rural poor will better equip small farmers to deal with future variability.
Some climate effects, however, are sufficiently clear to emphasize the need for new measures or expanded effort on other menu items:
- Farmers need effective regional crop-breeding systems that enable them to select alternative crop varieties specifically adapted to local conditions.
- Small-scale irrigation and water conservation systems will help farmers cope with rainfall variability.
- Research organizations and companies must breed new traits to overcome highly likely big climate challenges such as high temperature effects on maize, wheat, rice, and coffee.
- Governments must help fund adaptation to those major physical changes that are clearly predictable, such as altering production systems in areas that will be affected by sea level rise.
Figure 11
Climate change could shorten growing seasons in much of sub-Saharan Africa by more than 20 percent by 2100
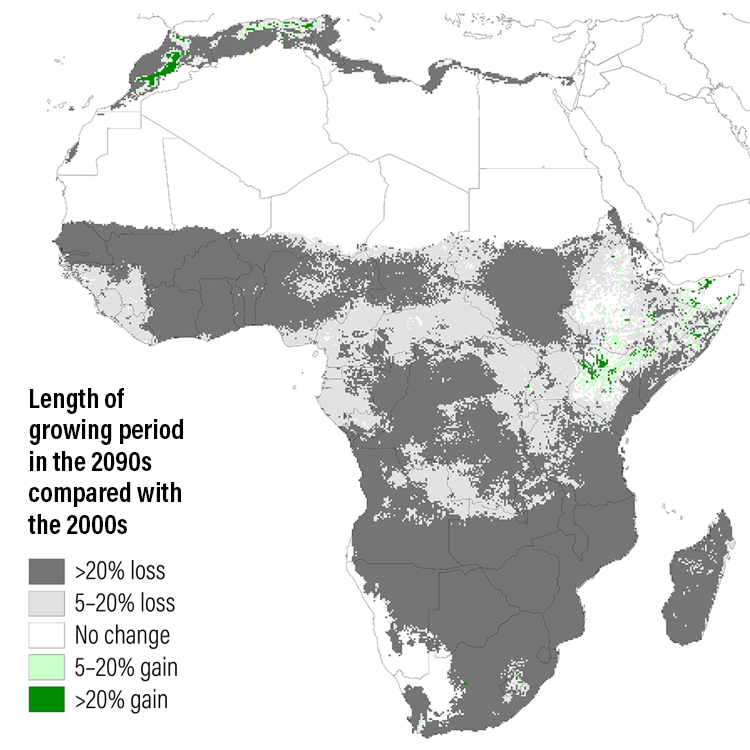
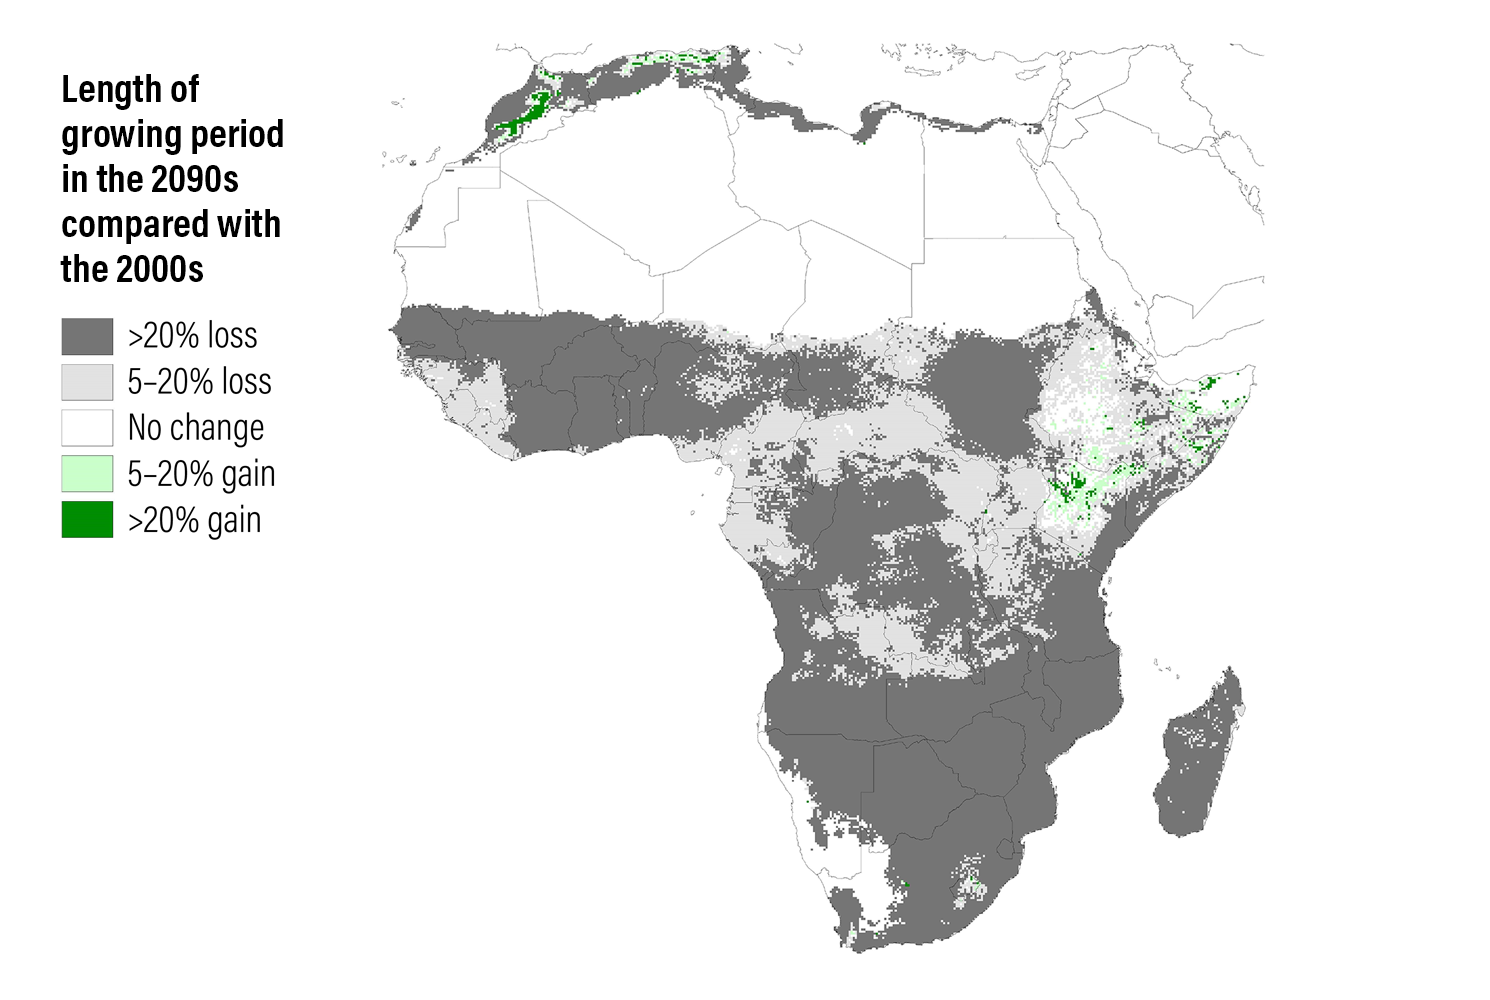 Source
Verhage et al. (2018) using methods from Jones and Thornton (2015).
-
The menu items in Course 2 are needed first merely to achieve our baseline. As Figure 9 and Table 2 show, the productivity gains assumed in our baseline projection close more than 80 percent of the land gap (and approximately two-thirds of the GHG mitigation gap) that would result if agricultural efficiency did not improve at all after 2010. We also modeled more optimistic scenarios to 2050, where, relative to the baseline projection, we assume a 25 percent faster rate in ruminant livestock productivity gains, 20 and 50 percent faster rates of growth in crop yield gains, and a 5 percent additional increase in cropping intensity.
Even these additional improvements leave significant land and GHG mitigation gaps (Table 2). This is why closing the land gap completely will require demand-side measures (Course 1) and action to protect and restore natural ecosystems (Course 3), and why closing the GHG mitigation gap completely will require action across all courses.
Table 2
Higher crop and livestock productivity could reduce agricultural land area and greenhouse gas emissions in 2050


Notes
“Cropland” includes cropland and aquaculture ponds. Numbers not summed correctly are due to rounding.
Source
GlobAgri-WRR model.
Endnotes
- 33AnimalChange (2012), Figure 7. This analysis focused on efficiencies based on protein (kg of protein in output, e.g., meat, divided by kilograms of protein in feed). This analysis also noted that feed conversion efficiencies were not widely different in different regions for the reasons we discuss related to backyard systems.
- 34Herrero et al. (2013).
- 35Herrero et al. (2013), Figure 4. Systems are defined in this paper, and in the so-called Seres-Steinfeld system, by whether they are grazing only, mixed systems of grazing and feeds (a broad category that varies from only 10% feed to 90% feed), or entirely feed-based, and whether they are in arid, temperate, or humid zones.
- 36Atlin et al. (2017).
- 37NAS (2016).
- 38Clustered Regularly Interspaced Short Palindromic Repeats and CRISPR-associated.
- 39FAO (2011a). Preliminary results from the Global Land Degradation Information System (GLADIS) assessment.
- 40Williams and Fritschel (2012); Bunderson (2012); Pretty et al. (2006); Branca et al. (2011).
- 41Arslan et al. (2015).
- 42Reij et al. (2009); Stevens et al. (2014); Reij and Winterbottom (2015).
- 43Aune and Bationo (2008); Vanlauwe et al. (2010).
- 44Giller et al. (2015); Williams and Fritschel (2012); Bationo et al. (2007).
- 45To develop an estimate of fallow land, we deduct 80 Mha of cropland from the total estimate of rainfed cropland in Table 4.9 in Alexandratos and Bruinsma (2012) to come up with land that is not double-cropped, and deduct 160 Mha of land from harvested area (reflecting two crops per year on 80 hectares of land). The resulting difference between single-cropped cropland and harvested area suggests around 350 Mha of fallow land each year. FAO (2017a) indicates a 251 Mha difference between total arable land (including land devoted to permanent crops such as trees) and harvested area in 2009. These figures differ somewhat from the 299 Mha presented in Alexandratos and Bruinsma (2012), which adjusted arable land and harvested land in a couple of ways. However, assuming that roughly 150 Mha were double-cropped for reasons discussed above, that means 400 Mha were not harvested at all.
- 46Siebert et al. (2010).
- 47Porter et al. (2014).
- 48World Bank (2012).
- 49Porter et al. (2014).
- 50Craparo et al. (2015); Eitzinger et al. (2011); Ortiz et al. (2008); Teixeira et al. (2013).
- 51IPCC (2014); Semenov et al. (2012); Teixeira et al. (2013).
- 52World Bank (2012); Lobell et al. (2008).