Course 1: Reduce Growth in Demand for Food and other Agricultural Products (Synthesis)
{"Glossary":{"51":{"name":"agricultural tree crops","description":"Trees cultivated for their food, cultural, or economic values. These include oil palm, rubber, cocoa, cashew, mango, oranges (citrus), plantain, banana, and coconut.\r\n"},"141":{"name":"agroforestry","description":"A diversified set of agricultural or agropastoral production systems that integrate trees in the agricultural landscape.\r\n"},"101":{"name":"albedo","description":"The ability of surfaces to reflect sunlight.\u0026nbsp;Light-colored surfaces return a large part of the sunrays back to the atmosphere (high albedo). Dark surfaces absorb the rays from the sun (low albedo).\r\n"},"94":{"name":"biodiversity intactness","description":"The proportion and abundance of a location\u0027s original forest community (number of species and individuals) that remain.\u0026nbsp;\r\n"},"95":{"name":"biodiversity significance","description":"The importance of an area for the persistence of forest-dependent species based on range rarity.\r\n"},"142":{"name":"boundary plantings","description":"Trees planted along boundaries or property lines to mark them well.\r\n"},"98":{"name":"carbon dioxide equivalent (CO2e)","description":"Carbon dioxide equivalent (CO2e) is a measure used to aggregate emissions from various greenhouse gases (GHGs) on the basis of their 100-year global warming potentials by equating non-CO2 GHGs to the equivalent amount of CO2.\r\n"},"99":{"name":"CO2e","description":"Carbon dioxide equivalent (CO2e) is a measure used to aggregate emissions from various greenhouse gases (GHGs) on the basis of their 100-year global warming potentials by equating non-CO2 GHGs to the equivalent amount of CO2.\r\n"},"1":{"name":"deforestation","description":"The change from forest to another land cover or land use, such as forest to plantation or forest to urban area.\r\n"},"77":{"name":"deforested","description":"The change from forest to another land cover or land use, such as forest to plantation or forest to urban area.\r\n"},"76":{"name":"degradation","description":"The reduction in a forest\u2019s ability to perform ecosystem services, such as carbon storage and water regulation, due to natural and anthropogenic changes.\r\n"},"75":{"name":"degraded","description":"The reduction in a forest\u2019s ability to perform ecosystem services, such as carbon storage and water regulation, due to natural and anthropogenic changes.\r\n"},"79":{"name":"disturbances","description":"A discrete event that changes the structure of a forest ecosystem.\r\n"},"68":{"name":"disturbed","description":"A discrete event that changes the structure of a forest ecosystem.\r\n"},"65":{"name":"driver of tree cover loss","description":"The direct cause of forest disturbance.\r\n"},"70":{"name":"drivers of loss","description":"The direct cause of forest disturbance.\r\n"},"81":{"name":"drivers of tree cover loss","description":"The direct cause of forest disturbance.\r\n"},"102":{"name":"evapotranspiration","description":"When solar energy hitting a forest converts liquid water into water vapor (carrying energy as latent heat) through evaporation and transpiration.\r\n"},"2":{"name":"forest","description":"Forests include tree cover greater than 30 percent tree canopy density and greater than 5 meters in height as mapped at a 30-meter Landsat pixel scale.\r\n"},"3":{"name":"forest concession","description":"A legal agreement allowing an entity the right to manage a public forest for production purposes.\r\n"},"90":{"name":"forest concessions","description":"A legal agreement allowing an entity the right to manage a public forest for production purposes.\r\n"},"53":{"name":"forest degradation","description":"The reduction in a forest\u2019s ability to perform ecosystem services, such as carbon storage and water regulation, due to natural and anthropogenic changes.\r\n"},"54":{"name":"forest disturbance","description":"A discrete event that changes the structure of a forest ecosystem.\r\n"},"100":{"name":"forest disturbances","description":"A discrete event that changes the structure of a forest ecosystem.\r\n"},"5":{"name":"forest fragmentation","description":"The breaking of large, contiguous forests into smaller pieces, with other land cover types interspersed.\r\n"},"6":{"name":"forest management plan","description":"A plan that documents the stewardship and use of forests and other wooded land to meet environmental, economic, social, and cultural objectives. Such plans are typically implemented by companies in forest concessions.\r\n"},"62":{"name":"forests","description":"Forests include tree cover greater than 30 percent tree canopy density and greater than 5 meters in height as mapped at a 30-meter Landsat pixel scale.\r\n"},"69":{"name":"fragmentation","description":"The breaking of large, contiguous forests into smaller pieces, with other land cover types interspersed.\r\n"},"80":{"name":"fragmented","description":"The breaking of large, contiguous forests into smaller pieces, with other land cover types interspersed.\r\n"},"74":{"name":"gain","description":"The establishment of tree canopy in an area that previously had no tree cover. Tree cover gain may indicate a number of potential activities, including natural forest growth or the crop rotation cycle of tree plantations.\r\n"},"143":{"name":"global land squeeze","description":"Pressure on finite land resources to produce food, feed and fuel for a growing human population while also sustaining biodiversity and providing ecosystem services.\r\n"},"7":{"name":"hectare","description":"One hectare equals 100 square meters, 2.47 acres, or 0.01 square kilometers and is about the size of a rugby field. A football pitch is slightly smaller than a hectare (pitches are between 0.62 and 0.82 hectares).\r\n"},"66":{"name":"hectares","description":"One hectare equals 100 square meters, 2.47 acres, or 0.01 square kilometers and is about the size of a rugby field. A football pitch is slightly smaller than a hectare (pitches are between 0.62 and 0.82 hectares).\r\n"},"67":{"name":"intact","description":"A forest that contains no signs of human activity or habitat fragmentation as determined by remote sensing images and is large enough to maintain all native biological biodiversity.\r\n"},"78":{"name":"intact forest","description":"A forest that contains no signs of human activity or habitat fragmentation as determined by remote sensing images and is large enough to maintain all native biological biodiversity.\r\n"},"8":{"name":"intact forests","description":"A forest that contains no signs of human activity or habitat fragmentation as determined by remote sensing images and is large enough to maintain all native biological biodiversity.\r\n"},"55":{"name":"land and environmental defenders","description":"People who peacefully promote and protect rights related to land and\/or the environment.\r\n"},"9":{"name":"loss driver","description":"The direct cause of forest disturbance.\r\n"},"10":{"name":"low tree canopy density","description":"Less than 30 percent tree canopy density.\r\n"},"84":{"name":"managed forest concession","description":"Areas where governments have given rights to private companies to harvest timber and other wood products from natural forests on public lands.\r\n"},"83":{"name":"managed forest concession maps for nine countries","description":"Cameroon, Canada, Central African Republic, Democratic Republic of the Congo, Equatorial Guinea, Gabon, Indonesia, Liberia, and the Republic of the Congo\r\n"},"104":{"name":"managed natural forests","description":"Naturally regenerated forests with signs of management, including logging, clear cuts, etc.\r\n"},"91":{"name":"megacities","description":"A city with more than 10 million people.\r\n"},"57":{"name":"megacity","description":"A city with more than 10 million people."},"56":{"name":"mosaic restoration","description":"Restoration that integrates trees into mixed-use landscapes, such as agricultural lands and settlements, where trees can support people through improved water quality, increased soil fertility, and other ecosystem services. This type of restoration is more likely in deforested or degraded forest landscapes with moderate population density (10\u2013100 people per square kilometer). "},"86":{"name":"natural","description":"A forest that is grown without human intervention.\r\n"},"12":{"name":"natural forest","description":"A forest that is grown without human intervention.\r\n"},"63":{"name":"natural forests","description":"A forest that is grown without human intervention.\r\n"},"144":{"name":"open canopy systems","description":"Individual tree crowns that do not overlap to form a continuous canopy layer.\r\n"},"82":{"name":"persistent gain","description":"Forests that have experienced one gain event from 2001 to 2016.\r\n"},"13":{"name":"persistent loss and gain","description":"Forests that have experienced one loss or one gain event from 2001 to 2016."},"97":{"name":"plantation","description":"An area in which trees have been planted, generally for commercial purposes.\u0026nbsp;\r\n"},"93":{"name":"plantations","description":"An area in which trees have been planted, generally for commercial purposes.\u0026nbsp;\r\n"},"88":{"name":"planted","description":"A forest composed of trees that have been deliberately planted and\/or seeded by humans.\r\n"},"14":{"name":"planted forest","description":"Stand of planted trees \u2014 other than tree crops \u2014 grown for wood and wood fiber production or for ecosystem protection against wind and\/or soil erosion.\r\n"},"73":{"name":"planted forests","description":"Stand of planted trees \u2014 other than tree crops \u2014 grown for wood and wood fiber production or for ecosystem protection against wind and\/or soil erosion."},"148":{"name":"planted trees","description":"Stand of trees established through planting, including both planted forest and tree crops."},"149":{"name":"Planted trees","description":"Stand of trees established through planting, including both planted forest and tree crops."},"15":{"name":"primary forest","description":"Old-growth forests that are typically high in carbon stock and rich in biodiversity. The GFR uses a humid tropical primary rainforest data set, representing forests in the humid tropics that have not been cleared in recent years.\r\n"},"64":{"name":"primary forests","description":"Old-growth forests that are typically high in carbon stock and rich in biodiversity. The GFR uses a humid tropical primary rainforest data set, representing forests in the humid tropics that have not been cleared in recent years.\r\n"},"58":{"name":"production forest","description":"A forest where the primary management objective is to produce timber, pulp, fuelwood, and\/or nonwood forest products."},"89":{"name":"production forests","description":"A forest where the primary management objective is to produce timber, pulp, fuelwood, and\/or nonwood forest products.\r\n"},"87":{"name":"seminatural","description":"A managed forest modified by humans, which can have a different species composition from surrounding natural forests.\r\n"},"59":{"name":"seminatural forests","description":"A managed forest modified by humans, which can have a different species composition from surrounding natural forests. "},"96":{"name":"shifting agriculture","description":"Temporary loss or permanent deforestation due to small- and medium-scale agriculture.\r\n"},"103":{"name":"surface roughness","description":"Surface roughness of forests creates\u0026nbsp;turbulence that slows near-surface winds and cools the land as it lifts heat from low-albedo leaves and moisture from evapotranspiration high into the atmosphere and slows otherwise-drying winds. \r\n"},"17":{"name":"tree cover","description":"All vegetation greater than five meters in height and may take the form of natural forests or plantations across a range of canopy densities. Unless otherwise specified, the GFR uses greater than 30 percent tree canopy density for calculations.\r\n"},"71":{"name":"tree cover canopy density is low","description":"Less than 30 percent tree canopy density.\r\n"},"60":{"name":"tree cover gain","description":"The establishment of tree canopy in an area that previously had no tree cover. Tree cover gain may indicate a number of potential activities, including natural forest growth or the crop rotation cycle of tree plantations.\u0026nbsp;As such, tree cover gain does not equate to restoration.\r\n"},"18":{"name":"tree cover loss","description":"The removal or mortality of tree cover, which can be due to a variety of factors, including mechanical harvesting, fire, disease, or storm damage. As such, loss does not equate to deforestation.\r\n"},"150":{"name":"tree crops","description":"Stand of perennial trees that produce agricultural products, such as rubber, oil palm, coffee, coconut, cocoa and orchards."},"19":{"name":"tree plantation","description":"An agricultural plantation of fast-growing tree species on short rotations for the production of timber, pulp, or fruit.\r\n"},"72":{"name":"tree plantations","description":"An agricultural plantation of fast-growing tree species on short rotations for the production of timber, pulp, or fruit.\r\n"},"85":{"name":"trees outside forests","description":"Trees found in urban areas, alongside roads, or within agricultural land\u0026nbsp;are often referred to as Trees Outside Forests (TOF).\u202f\r\n"},"151":{"name":"unmanaged","description":"Naturally regenerated forests without any signs of management, including primary forest."},"105":{"name":"unmanaged natural forests","description":"Naturally regenerated forests without any signs of management, including primary forest.\r\n"}}}
Course 1
Reduce Growth in Demand for Food and other Agricultural Products (Synthesis)
The size of the food challenge—and the associated environmental and economic challenges—depends on the scale of the increase in demand for crops and animal-based foods by midcentury. The food, land, and GHG mitigation gaps are derived from reasonable estimates of business-as-usual growth in demand for crops and livestock. Yet such levels of growth are not inevitable. Course 1 menu items explore ways to reduce this projected growth in socially and economically beneficial ways.

-
Of all the food produced in the world each year, approximately one-third by weight and one-quarter by calories is lost or wasted at various stages between the farm and the fork (Figure 4).14 Globally, food loss and waste results in nearly $1 trillion in economic losses,15 contributes to food insecurity in some developing countries, squanders agricultural land and water resources, and generates roughly one-quarter of all agricultural GHG emissions.16
Reducing food loss and waste in developed countries relies heavily on subtle “nudges” to change consumer behavior, such as eliminating the use of trays in cafeterias or streamlining product date labels. Many retail operations can reduce waste through improved inventory management and purchasing agreements that allow suppliers to plan better. Such strategies enabled the United Kingdom to reduce retail and consumer food waste by 21 percent between 2007 and 2012 (and overall food loss and waste by 14 percent).17 In developing countries, better harvesting equipment can reduce losses, as can agricultural practices that ripen crops for harvesting at more consistent times or produce food with more consistent qualities. Low-technology systems also exist to improve storage, including evaporative coolers and specially designed, low-cost plastic storage bags.
Despite these opportunities, large reductions globally are challenging because food loss and waste arises at so many different stages in the food chain, each one contributing only a small fraction of the whole. The complexity of food loss and waste sources leads us to propose three basic strategies:
- Target. Governments and companies should adopt food loss and waste reduction targets aligned with Sustainable Development Goal Target 12.3, which calls for reducing food loss and waste by 50 percent by 2030.
- Measure. Major actors in the food supply chain should more carefully measure sources of food loss and waste to identify hotspots, devise actions to reduce them, and assess progress.
- Act and Innovate. Many food producers, processors, and vast numbers of consumers will need to take a variety of actions. Many technological innovations will be needed, such as new methods that slow food degradation even without refrigeration and improved handling equipment that reduces damage.
Reducing food loss and waste by 25 percent globally would reduce the food calorie gap by 12 percent, the land use gap by 27 percent, and the GHG mitigation gap by 15 percent.
Figure 4
Food loss and waste primarily occurs closer to the consumer in developed regions and closer to the farmer in developing regions


Source
WRI analysis based on FAO (2011b).
-
We project consumption of animal-based foods to rise 68 percent between 2010 and 2050, with an 88 percent increase in consumption of ruminant meat (meat from cattle, sheep, and goats). These trends are a major driver of the food, land, and GHG mitigation gaps. For every food calorie generated, animal-based foods—and ruminant meats in particular—require many times more feed and land inputs, and emit far more greenhouse gases, than plant-based foods (Figure 5). 14
As nations urbanize and incomes rise above poverty levels, diets tend to become more varied and “Western”—high in sugar, fats, refined carbohydrates, meat, and dairy. Although modest consumption of meat and dairy by the world’s poor supplies critical micronutrients, the large global rise in consumption of animal-based foods is both unnecessary and unhealthy. Half of the world’s population already consumes 50 percent more protein than needed18 and, contrary to popular understanding, plant proteins can readily meet protein requirements in balanced diets that contain enough calories.19 New research downplays health risks from cholesterol and other saturated fats but has now identified processed meats as carcinogenic and red meat as probably carcinogenic.20
Researchers have long presented the environmental case for shifting high-meat diets toward plant-based foods, but achieving large global benefits is harder than often suggested, for two reasons. First, a common assumption is that, if people reduce meat consumption, they will instead consume much of the food formerly fed to animals (feed grains and oilseeds).21 However, in practice, people often shift from meat to dairy products, legumes, and vegetables.22 As shown in Figure 5, the land use and GHG emissions impacts of dairy products actually match or exceed those of pork and chicken and, while beans and vegetables are more environmentally efficient than meat, they are not as efficient as animal feeds. Second, a 10 percent global cut in consumption of all animal-based foods relative to the 2050 baseline, achieved by reducing consumption in wealthy regions, would be necessary just to allow 6 billion people across Asia and Africa to consume even half of Europe’s present consumption of such foods while staying within total consumption levels estimated in our baseline projection.23
Despite these cautions, by properly factoring in the consequences of diets on land use we find the potential of shifting diets to be even more consequential for GHG mitigation than commonly estimated. In a world where population and demand for food are growing, and yield gains are not keeping pace, agricultural land is expanding. Each person’s diet requires additional land-use change equal to the total land area needed to produce that diet, requiring conversion of forests and woody savannas to croplands and pasture. The effects on carbon are typically ignored. By counting the carbon dioxide released by that land-use change, and amortizing that amount over 20 years, we estimate that the average U.S. diet causes emissions of nearly 17 tons of CO2e per year—an amount on par with per capita emissions from energy use in the United States.24
Beef accounts for roughly half of land use and emissions associated with U.S. diets, but it provides just 3 percent of the calories. Major environmental benefits would therefore result simply from shifting from beef toward chicken or pork (Figure 5). If global consumers shifted 30 percent of their expected consumption of ruminant meat in 2050 to plant-based proteins, the shift would, by itself, close half the GHG mitigation gap and nearly all of the land gap. Such a shift would require roughly 2 billion people in countries that today eat high amounts of ruminant meats to reduce their consumption, on average, by 40 percent below 2010 levels to 1.5 servings per person per week—equivalent to 2010 consumption levels in the Middle East and North Africa (Figure 6). In China, the challenge would be to moderate the growth of ruminant meat consumption. The substantial shifts from beef toward chicken that have already occurred in U.S. and European diets since the 1970s suggest that such shifts are feasible.25 This shift would still allow global consumption of ruminant meats to grow by one-third (instead of the 88 percent growth in the baseline scenario) between 2010 and 2050.
Figure 5
Animal-based foods are more resource-intensive than plant-based foods


Note
Data presented are global means. Indicators for animal-based foods include resource use to produce feed, including pasture. Tons of harvested products were converted to quantities of calories and protein using the global average edible calorie and protein contents of food types as reported in FAO (2017a). “Fish” includes all aquatic animal-based foods. Estimates are based on a marginal analysis of additional agricultural land use and emissions per additional million calories consumed. Based on the approach taken by the European Union for estimating emissions from land-use change for biofuels, land-use-change impacts are amortized over a period of 20 years and then shown as annual impacts. Estimates of land use and greenhouse gas emissions for beef production are based on dedicated beef production, not beef that is a coproduct of dairy. Dairy figures are lower in GlobAgri-WRR than some other models because GlobAgri-WRR assumes that beef produced by dairy systems displaces beef produced by dedicated beef-production systems.
Source
GlobAgri-WRR model.
Three strategies will be necessary to shift consumption toward healthier and lower-impact diets:
- Product innovation. Businesses should continue to increase investment in development of meat substitutes (e.g., plant-based meats) and blended meat-plant products until they satisfy consumers who still want to enjoy the taste and experience of eating meat at less cost.
- Promotion and marketing. Businesses, government, and civil society need to move beyond relying solely on information and education campaigns to shift diets. Rather, they should improve marketing of plant-based foods and plant-rich dishes. A suite of more sophisticated behavior-change strategies, including minimizing disruption to consumers, selling a compelling benefit, maximizing awareness, and evolving social norms, has proven successful in shifting consumption patterns in other food and nonfood products.26
- Policy and pricing. Governments can support diet shifts through their own food procurement practices and policies that shape the consumption environment (e.g., marketing, display). Once the quality and price of nonmeat alternatives rival that of meat, retail-level taxes on meats or other animal-based foods might become politically acceptable.
Figure 6
Limiting ruminant meat consumption to 52 calories per person per day in all regions reduces the greenhouse gas mitigation gap by half and nearly closes the land gap


Source
GlobAgri-WRR model, with source data from FAO (2017a); UNDESA (2017); FAO (2011b); and Alexandratos and Bruinsma (2012)
-
Bioenergy is produced mainly from food and energy crops grown on dedicated land, which increases global competition for land and widens the food, land, and GHG mitigation gaps. Our 2050 baseline projection assumes that the share of biofuels from crops in transportation fuel remains at 2010 levels, but many governments have adopted goals to increase biofuel’s share fourfold or more.27 Such an increase globally would supply about 2 percent of total energy use in 2050 but would increase the food gap from 56 to 78 percent. Still more ambitious goals—to supply 20 percent of world energy from bioenergy by 2050—would require a quantity of biomass equal to all the world’s harvested crops, crop residues, forage, and wood in 2000 (Figure 7).
Bioenergy creates so much potential competition for food and carbon storage because bioenergy converts only a fraction of 1 percent of energy from the sun into usable energy. Food or energy crops also require well-watered, productive land. By contrast, solar photovoltaic (PV) cells today can use drylands and they produce at least 100 times more useable energy per hectare than energy crops are likely to produce in the future, even when grown on well-watered lands.28
Burning (and refining) biomass also emits more carbon per unit of energy generated than burning fossil fuels. Claims that bioenergy reduces GHG emissions rely on the assumption that this carbon does not “count” because burning plants only returns carbon to the air that growing plants absorb. But diverting land to produce bioenergy comes at the cost of not using this land and the plants it grows for other purposes, including food production and carbon storage. To provide bioenergy without losing these other services, people must either grow additional plants or use organic waste as a feedstock. Some low-carbon bioenergy is available from wastes and possibly from winter cover crops. But claims of large bioenergy potential to reduce GHG emissions ignore the alternative uses of land and plants, in effect assuming they can continue to serve other needs even when dedicated to bioenergy.
Avoiding increased use of bioenergy from energy and food crops is critical to a sustainable food future. Phasing out existing levels of biofuel use would reduce the crop calorie gap from 56 to 49 percent. Governments should phase out subsidies currently in place for bioenergy that is grown on dedicated land. Governments also need to correct “flawed accounting” in renewable energy directives and emissions trading laws that treat bioenergy as “carbon-neutral.”
Figure 7
If the world’s entire harvest of crops, crop residues, grasses, and wood in 2000 were used for bioenergy, it would provide only 20 percent of energy needs in 2050


Note
Assumes primary to final energy conversion for biomass is 24% lower than for fossil energy.
Source
Authors’ calculations based on Haberl et al. (2007); IEA (2017); and JRC (2011).
-
Expected population growth of 2.8 billion people between 2010 and 205029 drives the majority of expected growth in food demand. Roughly half of this population increase will occur in Africa, and one-third will occur in Asia. Overall, most of the world—including Asia—is close to achieving replacement-level fertility (~2.1 children per woman) and will achieve or even dip below it by 2050.30
Sub-Saharan Africa is the notable exception, with a total fertility rate above 5 in 2010–15 and a projected rate of 3.2 in 2050. As a result, sub-Saharan Africa’s population, which was 880 million in 2010, is projected to reach 2.2 billion by 2050 and 4 billion by 2100.31 This population growth risks exacerbating food insecurity in a region that is already home to 30 percent of the world’s chronically hungry people.32
Given the choice, people worldwide have voluntarily chosen to greatly reduce their fertility rates—even in extremely poor countries and across religions and cultures—wherever countries have achieved three forms of social progress:
- Increased educational opportunities for girls, ensuring they get at least a lower secondary education (i.e., some high school). The longer girls stay in school, the later they typically start bearing children and the fewer children they bear.
- Increased access to reproductive health services, including family planning, to ensure couples can have the family sizes they desire and reduce maternal mortality.
- Reduce infant and child mortality, so parents do not need to have many children to ensure survival of the desired number.
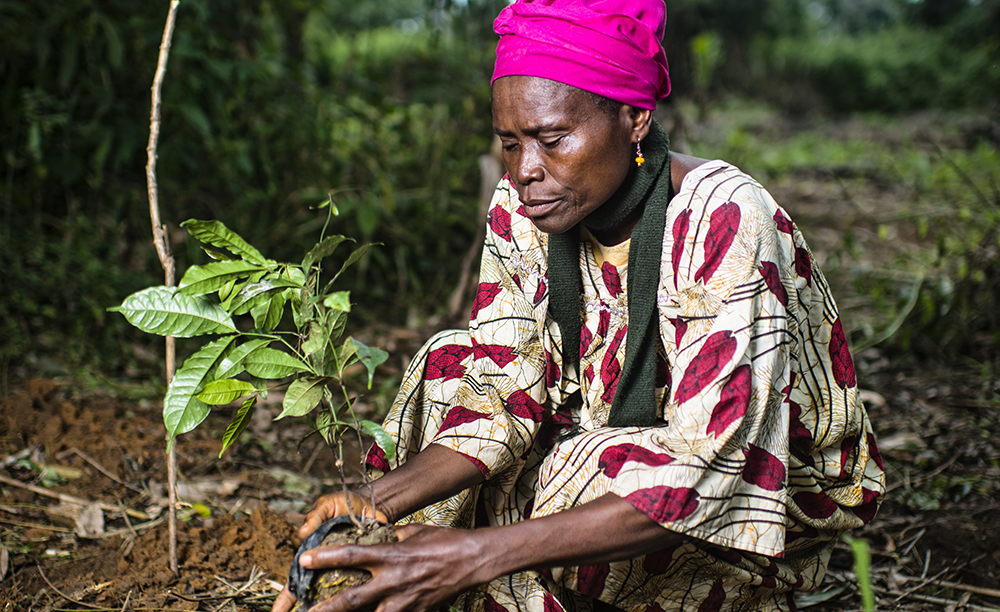
Reducing fertility also tends to produce strong economic dividends. Unfortunately, sub-Saharan Africa lags behind in these measures (Figure 8). Most African countries have adopted a goal of reducing population growth, so the challenge is to direct adequate resources to these strategies, develop the necessary administrative and technical capacity, and mobilize civil society.
If sub-Saharan Africa could move toward replacement-level fertility rates by 2050, its population would grow to only 1.8 billion. The regional growth in crop demand would then decline by nearly one-third relative to our baseline projection. The region’s farmers would need to clear only 97 Mha of forests and savannas for agriculture rather than the 260 Mha in our baseline projection, closing one-quarter of the global land gap. The global GHG mitigation gap would decline by 17 percent.
Figure 8
Sub-Saharan Africa has the world’s lowest performance in key indicators of total fertility rate, women’s education, and child mortality
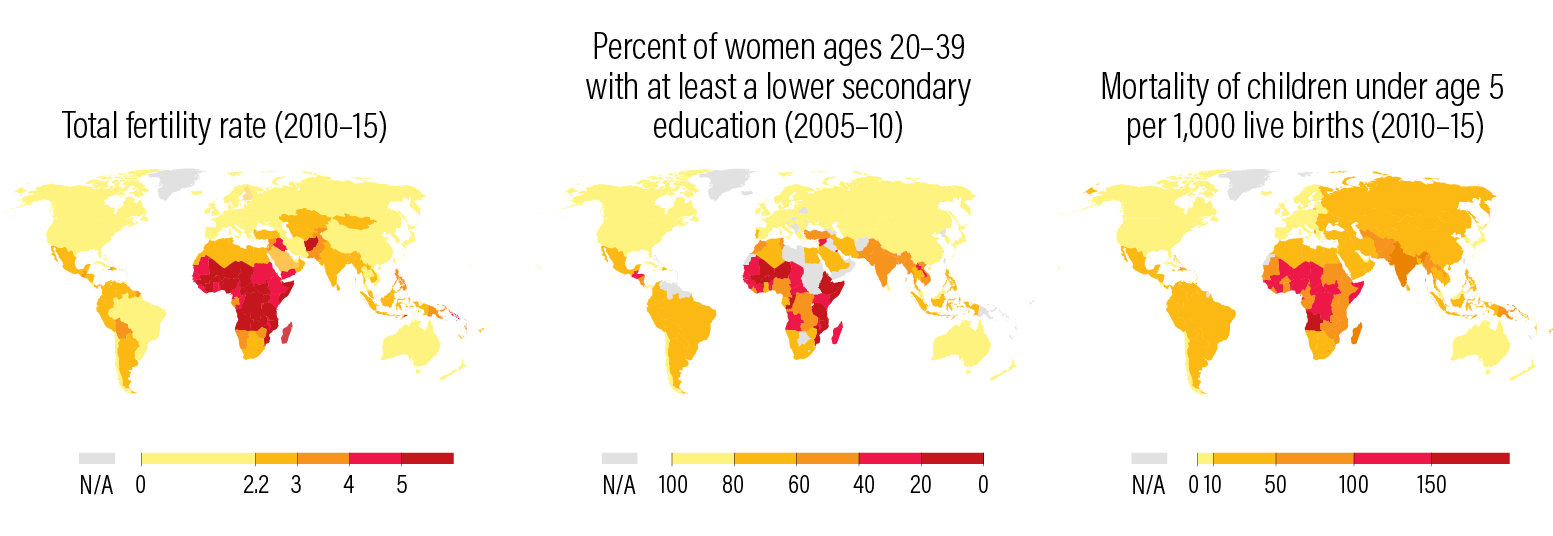
Sources
UNDESA (2017); Harper (2012); World Bank (2017a).
Endnotes
- 14FAO (2011b) estimated this figure at one-third as measured by weight. This is a rough estimate given that it extrapolates from individual food loss and waste studies across countries and stages of the food supply chain. Subsequent research papers have found wide variations in food loss and waste estimates. This report’s authors estimated the figure of one-quarter as measured by calories by using FAO Food Balance Sheets (FAO 2017a), which convert metric tons into calories per type of food. We convert tons into calories in order to estimate the impact of food loss and waste on the food gap (which we measure in calories) and in order to more closely reflect the nutritional value of food, since a lot of weight in food is water. Measuring by calories avoids the water embedded in food. Kummu et al. (2012) separately found loss and waste on a caloric basis to equal 24% of all food produced.
- 15FAO (2015). The precise FAO figure is $940 billion.
- 16FAO (2015).
- 17Lipinski et al. (2013)
- 18In 2010, approximately half of the world population consumed at least 75 grams of protein per day (GlobAgri-WRR model based on source data from FAO 2017a and FAO 2011b), whereas the average daily protein requirement for adults is around 50 grams per day, which incorporates a margin of safety to reflect individual differences. Protein requirements differ by individual based on age, sex, height, weight, level of physical activity, pregnancy, and lactation (FAO, WHO, and UNU [1985]). Similar to other developed countries, the U.S. government (CDC [2015]) lists the estimated daily requirement for protein as 56 grams per day for an adult man and 46 grams per day for an adult woman, or an average of 51 grams of protein per day. Paul (1989) estimates the average protein requirement at 0.8 grams per kilogram of body weight per day. Since the average adult in the world weighed 62 kilograms in 2005 (Walpole et al. [2012]), applying the rule of 0.8 grams/kilogram/day would yield an estimated global average protein requirement of 49.6 grams per day. Other international estimates are lower still. For instance, FAO, WHO, and UNU (1985) estimate an average requirement of 0.75 grams/kilogram/day. Furthermore, these estimates are conservative to ensure that they cover individual variations within a population group. For example, the estimated protein requirement of 0.8 grams per kilogram of body weight per day given in Paul (1989) includes 0.35 grams/kilogram/day as a safety margin.
- 19Craig and Mangels (2009).
- 20Bouvard et al. (2015). “Processed meat” refers to meat that has been transformed through salting, curing, fermentation, smoking, or other processes to enhance flavor or improve preservation. Most processed meats contain pork or beef but might also contain other red meats, poultry, offal (e.g., liver), or meat by-products such as blood.
- 21Foley et al. (2011).
- 22Scarborough et al. (2014).
- 23GlobAgri-WRR model. In 2010, consumption of animal-based foods in Europe was 772 calories per capita per day. In our baseline 2050 scenario, consumption of animal-based foods in sub-Saharan Africa is still projected to be only 201 calories per capita per day. If, instead, consumption in sub-Saharan Africa grew to 386 calories per capita per day (or half of Europe’s 2010 per capita consumption, and on par with 2050 baseline consumption projections for the rest of Africa and Asia outside of China and Japan), that additional growth in consumption would completely offset a theoretical 10 percent global reduction in animal-based food consumption (achieved by a 17 percent reduction in Europe, North America, Brazil, China, and other OECD countries). In short: our baseline is arguably conservative in estimating total consumption of animal-based foods in 2050.
- 24Using the GlobAgri-WRR model, we estimate U.S. dietary emissions in 2010 (including land-use change) at 16.6 tons CO2e per person per year. Total U.S. energy-related emissions of 5,582 million tons CO2 (EIA 2015), when divided by a U.S. population of 309.3 million, equal per capita emissions of 18 tons CO2e in 2010. Energy-related CO2 emissions are those stemming from the burning of fossil fuels. These estimates differ in that the dietary land-use-change emissions include the global consequences of diets, while the energy-related emissions calculate only those emissions from energy use within the United States. Factoring in a portion of energy emissions associated with imported products increases those U.S. energy emissions somewhat. For example, Davis and Caldeira (2010) estimate that U.S. consumption-based CO2 emissions (defined as the amount of emissions associated with the consumption of goods and services in a country, after accounting for imports and exports) were 22 tons per capita per year in 2004.
- 25FAO (2017a).
- 26Ranganathan et al. (2016).
- 27IEA (2016) in REN21 (2017).
- 28Searchinger et al. (2017).
- 29UNDESA (2017). Total population by major area, region, and country (“medium-fertility variant” or medium growth scenario)
- 30UNDESA (2017).
- 31UNDESA (2017).
- 32Authors’ calculations from FAO, IFAD, UNICEF, et al. (2017); and UNDESA (2017).
-