Course 5: Reduce Greenhouse Gas Emissions from Agricultural Production (Synthesis)
{"Glossary":{"51":{"name":"agricultural tree crops","description":"Trees cultivated for their food, cultural, or economic values. These include oil palm, rubber, cocoa, cashew, mango, oranges (citrus), plantain, banana, and coconut.\r\n"},"141":{"name":"agroforestry","description":"A diversified set of agricultural or agropastoral production systems that integrate trees in the agricultural landscape.\r\n"},"101":{"name":"albedo","description":"The ability of surfaces to reflect sunlight.\u0026nbsp;Light-colored surfaces return a large part of the sunrays back to the atmosphere (high albedo). Dark surfaces absorb the rays from the sun (low albedo).\r\n"},"94":{"name":"biodiversity intactness","description":"The proportion and abundance of a location\u0027s original forest community (number of species and individuals) that remain.\u0026nbsp;\r\n"},"95":{"name":"biodiversity significance","description":"The importance of an area for the persistence of forest-dependent species based on range rarity.\r\n"},"142":{"name":"boundary plantings","description":"Trees planted along boundaries or property lines to mark them well.\r\n"},"98":{"name":"carbon dioxide equivalent (CO2e)","description":"Carbon dioxide equivalent (CO2e) is a measure used to aggregate emissions from various greenhouse gases (GHGs) on the basis of their 100-year global warming potentials by equating non-CO2 GHGs to the equivalent amount of CO2.\r\n"},"99":{"name":"CO2e","description":"Carbon dioxide equivalent (CO2e) is a measure used to aggregate emissions from various greenhouse gases (GHGs) on the basis of their 100-year global warming potentials by equating non-CO2 GHGs to the equivalent amount of CO2.\r\n"},"1":{"name":"deforestation","description":"The change from forest to another land cover or land use, such as forest to plantation or forest to urban area.\r\n"},"77":{"name":"deforested","description":"The change from forest to another land cover or land use, such as forest to plantation or forest to urban area.\r\n"},"76":{"name":"degradation","description":"The reduction in a forest\u2019s ability to perform ecosystem services, such as carbon storage and water regulation, due to natural and anthropogenic changes.\r\n"},"75":{"name":"degraded","description":"The reduction in a forest\u2019s ability to perform ecosystem services, such as carbon storage and water regulation, due to natural and anthropogenic changes.\r\n"},"79":{"name":"disturbances","description":"A discrete event that changes the structure of a forest ecosystem.\r\n"},"68":{"name":"disturbed","description":"A discrete event that changes the structure of a forest ecosystem.\r\n"},"65":{"name":"driver of tree cover loss","description":"The direct cause of forest disturbance.\r\n"},"70":{"name":"drivers of loss","description":"The direct cause of forest disturbance.\r\n"},"81":{"name":"drivers of tree cover loss","description":"The direct cause of forest disturbance.\r\n"},"102":{"name":"evapotranspiration","description":"When solar energy hitting a forest converts liquid water into water vapor (carrying energy as latent heat) through evaporation and transpiration.\r\n"},"2":{"name":"forest","description":"Forests include tree cover greater than 30 percent tree canopy density and greater than 5 meters in height as mapped at a 30-meter Landsat pixel scale.\r\n"},"3":{"name":"forest concession","description":"A legal agreement allowing an entity the right to manage a public forest for production purposes.\r\n"},"90":{"name":"forest concessions","description":"A legal agreement allowing an entity the right to manage a public forest for production purposes.\r\n"},"53":{"name":"forest degradation","description":"The reduction in a forest\u2019s ability to perform ecosystem services, such as carbon storage and water regulation, due to natural and anthropogenic changes.\r\n"},"54":{"name":"forest disturbance","description":"A discrete event that changes the structure of a forest ecosystem.\r\n"},"100":{"name":"forest disturbances","description":"A discrete event that changes the structure of a forest ecosystem.\r\n"},"5":{"name":"forest fragmentation","description":"The breaking of large, contiguous forests into smaller pieces, with other land cover types interspersed.\r\n"},"6":{"name":"forest management plan","description":"A plan that documents the stewardship and use of forests and other wooded land to meet environmental, economic, social, and cultural objectives. Such plans are typically implemented by companies in forest concessions.\r\n"},"62":{"name":"forests","description":"Forests include tree cover greater than 30 percent tree canopy density and greater than 5 meters in height as mapped at a 30-meter Landsat pixel scale.\r\n"},"69":{"name":"fragmentation","description":"The breaking of large, contiguous forests into smaller pieces, with other land cover types interspersed.\r\n"},"80":{"name":"fragmented","description":"The breaking of large, contiguous forests into smaller pieces, with other land cover types interspersed.\r\n"},"74":{"name":"gain","description":"The establishment of tree canopy in an area that previously had no tree cover. Tree cover gain may indicate a number of potential activities, including natural forest growth or the crop rotation cycle of tree plantations.\r\n"},"143":{"name":"global land squeeze","description":"Pressure on finite land resources to produce food, feed and fuel for a growing human population while also sustaining biodiversity and providing ecosystem services.\r\n"},"7":{"name":"hectare","description":"One hectare equals 100 square meters, 2.47 acres, or 0.01 square kilometers and is about the size of a rugby field. A football pitch is slightly smaller than a hectare (pitches are between 0.62 and 0.82 hectares).\r\n"},"66":{"name":"hectares","description":"One hectare equals 100 square meters, 2.47 acres, or 0.01 square kilometers and is about the size of a rugby field. A football pitch is slightly smaller than a hectare (pitches are between 0.62 and 0.82 hectares).\r\n"},"67":{"name":"intact","description":"A forest that contains no signs of human activity or habitat fragmentation as determined by remote sensing images and is large enough to maintain all native biological biodiversity.\r\n"},"78":{"name":"intact forest","description":"A forest that contains no signs of human activity or habitat fragmentation as determined by remote sensing images and is large enough to maintain all native biological biodiversity.\r\n"},"8":{"name":"intact forests","description":"A forest that contains no signs of human activity or habitat fragmentation as determined by remote sensing images and is large enough to maintain all native biological biodiversity.\r\n"},"55":{"name":"land and environmental defenders","description":"People who peacefully promote and protect rights related to land and\/or the environment.\r\n"},"9":{"name":"loss driver","description":"The direct cause of forest disturbance.\r\n"},"10":{"name":"low tree canopy density","description":"Less than 30 percent tree canopy density.\r\n"},"84":{"name":"managed forest concession","description":"Areas where governments have given rights to private companies to harvest timber and other wood products from natural forests on public lands.\r\n"},"83":{"name":"managed forest concession maps for nine countries","description":"Cameroon, Canada, Central African Republic, Democratic Republic of the Congo, Equatorial Guinea, Gabon, Indonesia, Liberia, and the Republic of the Congo\r\n"},"104":{"name":"managed natural forests","description":"Naturally regenerated forests with signs of management, including logging, clear cuts, etc.\r\n"},"91":{"name":"megacities","description":"A city with more than 10 million people.\r\n"},"57":{"name":"megacity","description":"A city with more than 10 million people."},"56":{"name":"mosaic restoration","description":"Restoration that integrates trees into mixed-use landscapes, such as agricultural lands and settlements, where trees can support people through improved water quality, increased soil fertility, and other ecosystem services. This type of restoration is more likely in deforested or degraded forest landscapes with moderate population density (10\u2013100 people per square kilometer). "},"86":{"name":"natural","description":"A forest that is grown without human intervention.\r\n"},"12":{"name":"natural forest","description":"A forest that is grown without human intervention.\r\n"},"63":{"name":"natural forests","description":"A forest that is grown without human intervention.\r\n"},"144":{"name":"open canopy systems","description":"Individual tree crowns that do not overlap to form a continuous canopy layer.\r\n"},"82":{"name":"persistent gain","description":"Forests that have experienced one gain event from 2001 to 2016.\r\n"},"13":{"name":"persistent loss and gain","description":"Forests that have experienced one loss or one gain event from 2001 to 2016."},"97":{"name":"plantation","description":"An area in which trees have been planted, generally for commercial purposes.\u0026nbsp;\r\n"},"93":{"name":"plantations","description":"An area in which trees have been planted, generally for commercial purposes.\u0026nbsp;\r\n"},"88":{"name":"planted","description":"A forest composed of trees that have been deliberately planted and\/or seeded by humans.\r\n"},"14":{"name":"planted forest","description":"Stand of planted trees \u2014 other than tree crops \u2014 grown for wood and wood fiber production or for ecosystem protection against wind and\/or soil erosion.\r\n"},"73":{"name":"planted forests","description":"Stand of planted trees \u2014 other than tree crops \u2014 grown for wood and wood fiber production or for ecosystem protection against wind and\/or soil erosion."},"148":{"name":"planted trees","description":"Stand of trees established through planting, including both planted forest and tree crops."},"149":{"name":"Planted trees","description":"Stand of trees established through planting, including both planted forest and tree crops."},"15":{"name":"primary forest","description":"Old-growth forests that are typically high in carbon stock and rich in biodiversity. The GFR uses a humid tropical primary rainforest data set, representing forests in the humid tropics that have not been cleared in recent years.\r\n"},"64":{"name":"primary forests","description":"Old-growth forests that are typically high in carbon stock and rich in biodiversity. The GFR uses a humid tropical primary rainforest data set, representing forests in the humid tropics that have not been cleared in recent years.\r\n"},"58":{"name":"production forest","description":"A forest where the primary management objective is to produce timber, pulp, fuelwood, and\/or nonwood forest products."},"89":{"name":"production forests","description":"A forest where the primary management objective is to produce timber, pulp, fuelwood, and\/or nonwood forest products.\r\n"},"87":{"name":"seminatural","description":"A managed forest modified by humans, which can have a different species composition from surrounding natural forests.\r\n"},"59":{"name":"seminatural forests","description":"A managed forest modified by humans, which can have a different species composition from surrounding natural forests. "},"96":{"name":"shifting agriculture","description":"Temporary loss or permanent deforestation due to small- and medium-scale agriculture.\r\n"},"103":{"name":"surface roughness","description":"Surface roughness of forests creates\u0026nbsp;turbulence that slows near-surface winds and cools the land as it lifts heat from low-albedo leaves and moisture from evapotranspiration high into the atmosphere and slows otherwise-drying winds. \r\n"},"17":{"name":"tree cover","description":"All vegetation greater than five meters in height and may take the form of natural forests or plantations across a range of canopy densities. Unless otherwise specified, the GFR uses greater than 30 percent tree canopy density for calculations.\r\n"},"71":{"name":"tree cover canopy density is low","description":"Less than 30 percent tree canopy density.\r\n"},"60":{"name":"tree cover gain","description":"The establishment of tree canopy in an area that previously had no tree cover. Tree cover gain may indicate a number of potential activities, including natural forest growth or the crop rotation cycle of tree plantations.\u0026nbsp;As such, tree cover gain does not equate to restoration.\r\n"},"18":{"name":"tree cover loss","description":"The removal or mortality of tree cover, which can be due to a variety of factors, including mechanical harvesting, fire, disease, or storm damage. As such, loss does not equate to deforestation.\r\n"},"150":{"name":"tree crops","description":"Stand of perennial trees that produce agricultural products, such as rubber, oil palm, coffee, coconut, cocoa and orchards."},"19":{"name":"tree plantation","description":"An agricultural plantation of fast-growing tree species on short rotations for the production of timber, pulp, or fruit.\r\n"},"72":{"name":"tree plantations","description":"An agricultural plantation of fast-growing tree species on short rotations for the production of timber, pulp, or fruit.\r\n"},"85":{"name":"trees outside forests","description":"Trees found in urban areas, alongside roads, or within agricultural land\u0026nbsp;are often referred to as Trees Outside Forests (TOF).\u202f\r\n"},"151":{"name":"unmanaged","description":"Naturally regenerated forests without any signs of management, including primary forest."},"105":{"name":"unmanaged natural forests","description":"Naturally regenerated forests without any signs of management, including primary forest.\r\n"}}}
Course 5
Reduce Greenhouse Gas Emissions from Agricultural Production (Synthesis)
Agricultural production emissions arise from livestock farming, application of nitrogen fertilizers, rice cultivation, and energy use. These production processes are traditionally regarded as hard to control. In general, our estimates of mitigation potential in this course are more optimistic than others’, partly because many analyses have not fully captured the opportunities for productivity gains and partly because we factor in promising potential for technological innovations.
Even with Large Productivity Gains, We Project Production Emissions to Rise
Annual emissions from agricultural production processes (i.e., excluding emissions from land-use change) reach 9 Gt in our 2050 baseline (Figure 17), leaving a 5 Gt GHG mitigation gap relative to our target emissions level of 4 Gt. The baseline already incorporates large productivity gains, without which the gap would rise to 7 Gt. Most production emissions take the form of two trace gases with powerful warming effects, nitrous oxide and methane.
Figure 17 |
Annual agricultural production emissions reach 9 gigatons in our 2050 baseline projection

Source
GlobAgri-WRR model.
-
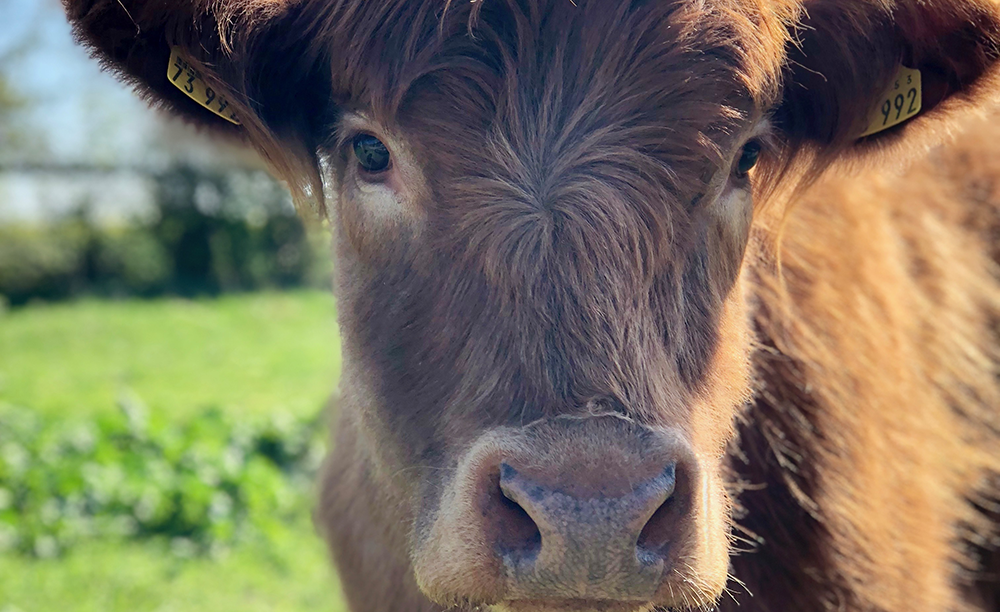
Ruminant livestock (mainly cattle, sheep, and goats) generate roughly half of all agricultural production emissions. Of these emissions, the largest source is “enteric methane,” generated by microbes in ruminant stomachs.
The same measures needed to increase productivity of ruminants and reduce land-use demands will also reduce methane emissions, mainly because more milk and meat is produced per kilogram of feed. Because the improvements are greatest when moving from the worst-quality feeds to even average-quality feeds, the greatest opportunities to reduce emissions exist in poorer countries. Improving highly inefficient systems causes emissions per kilogram of meat or milk to fall very sharply at first as output per animal increases (Figure 18).
Other strategies to reduce enteric methane emissions rely on manipulating microbiological communities in the ruminant stomach by using vaccines; selectively breeding animals that naturally produce fewer emissions; or incorporating special feeds, drugs, or supplements into diets. These efforts have mostly proved unsuccessful. For example, despite testing thousands of compounds, researchers have found that methane-producing microbes quickly adapt to drugs that initially inhibited them.75
More recently, at least one highly promising option has emerged that persistently reduces methane emissions by 30 percent, and may also increase animal growth rates.76 So far, this compound—called 3-nitrooxypropan (3-NOP)—requires daily feeding at a minimum, so it is not feasible today for most grazing operations unless dosing can be refined.
Enteric fermentation, atypically, is receiving a reasonable level of R&D funding. It is possible that 3-NOP could eventually pay for itself through reduced feed needs or increased productivity, but these benefits are not guaranteed. However, because the compound will be highly cost-effective for GHG mitigation, we recommend that governments consider three policies:
- Provide incentives to the private sector by promising to require use of 3-NOP or other compounds if and when they are proven to mitigate emissions at a reasonable cost.
- Fund large-scale 3-NOP or related demonstration projects in the short term.
- Maintain public research into compounds to reduce methane from enteric fermentation.
Figure 18 |
More efficient milk production reduces greenhouse gas emissions dramatically
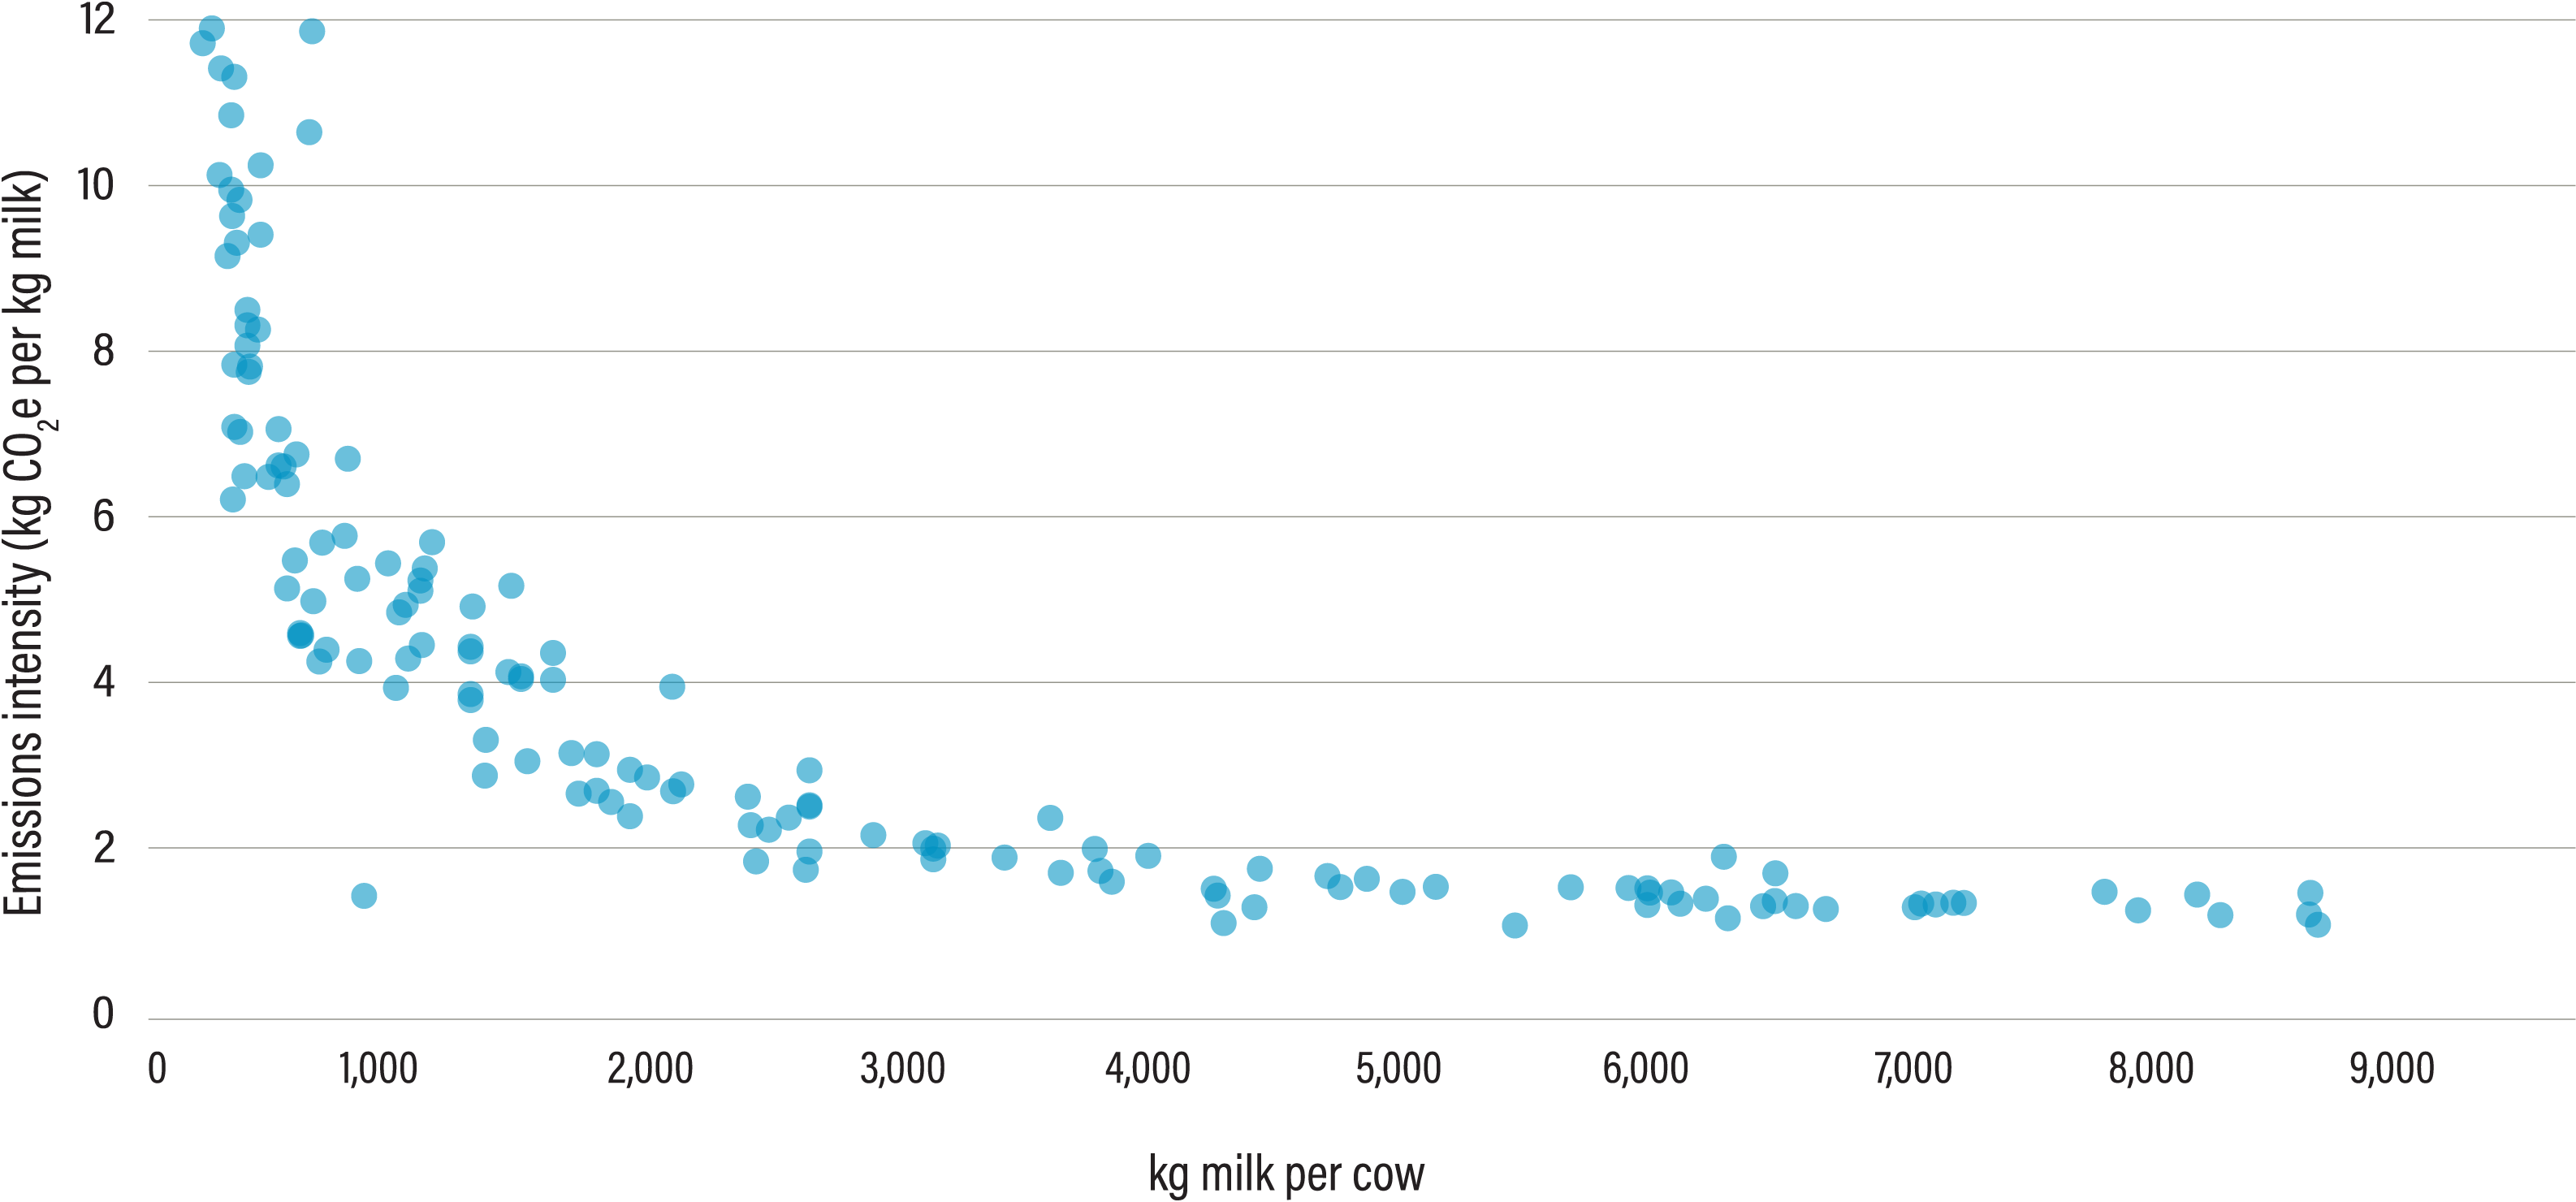
Note
Dots represent country averages.
Source
Gerber et al. (2013).
-
Fertilizers applied to crops and pastures (mostly synthetic fertilizers but also manure and other sources) were responsible for estimated emissions of 1.3 Gt CO2e in 2010. Nearly all these emissions result from the manufacture, transportation, and application of nitrogen. We project that these emissions will rise to 1.7 Gt by 2050 in our baseline scenario. Globally, crops absorb less than half the nitrogen applied to farm fields. The rest runs off into ground or surface waters, causing pollution, or escapes into the air as gases, including the potent heat-trapping gas nitrous oxide. Countries, and individual farms, vary greatly in their rates of nitrogen application per hectare and in the percentage of nitrogen that is absorbed by crops rather than lost to the environment (known as “nitrogen use efficiency,” or NUE) (Figure 19).
Mitigation strategies focus on changing agronomic practices. Technically, extremely high rates of efficiency are possible if farmers are willing to assess nitrogen needs and apply nitrogen frequently in just the required amount over the course of a growing season. The challenge is that such intensive management is expensive while nitrogen fertilizer is cheap. Therefore, we believe innovations are required. Nitrification inhibitors and other “enhanced efficiency” fertilizers can increase NUE, reduce nitrous oxide emissions, and increase yields. But they are used with only 2 percent of global fertilizers,85 probably because of wide variability in performance and because fertilizer manufacturers today spend little money to improve them. Biological nitrification inhibition is another promising option for crops and pasture grasses but receives little financial support.
We modeled various scenarios of NUE improvement and found that achieving an ambitious global average NUE of 71 percent by 2050 would reduce emissions by 600 million tons, although that would only keep nitrogen emissions close to their 2010 levels. The scope of the nitrogen challenge requires governments to focus on innovative policy approaches:
- Implement flexible regulatory targets to push fertilizer companies to develop improved fertilizers. India provides the closest example to date with its New Urea Policy adopted in 2015.
- Shift subsidies from fertilizers to support for higher NUE, where nitrogen use is excessive.
- Support critical research, particularly into biological nitrification inhibition.
- Fund demonstration projects involving researchers and high nitrogen-using farmers to pursue higher NUE using inhibitors and other innovative technologies.
Figure 19 |
The percentage of applied nitrogen that is absorbed by crops varies widely across the world
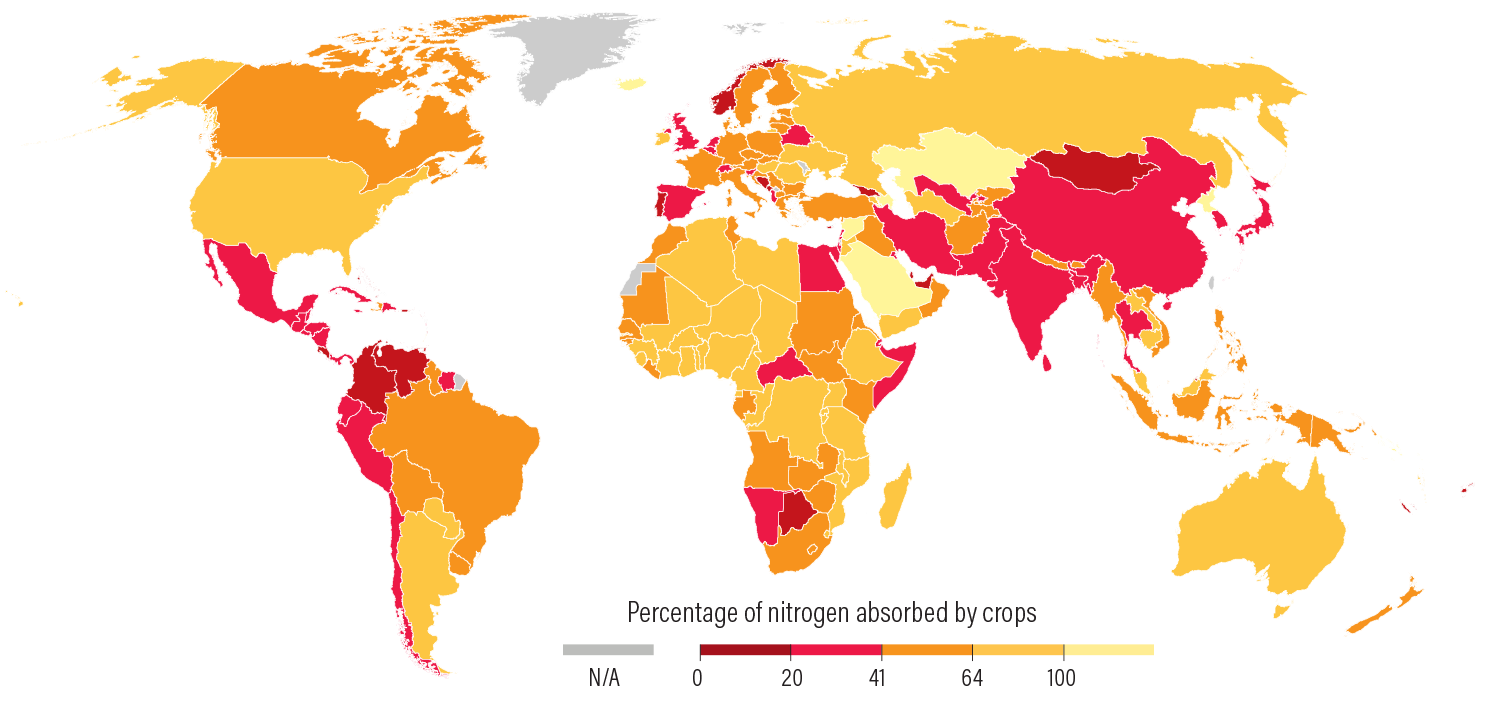
Source
Zhang et al. (2015).
-
Because reducing agricultural production emissions is challenging, much academic and policy attention has focused on strategies to sequester carbon in agricultural soils to offset those emissions. There are only two ways to boost soil carbon: add more or lose less. But recent scholarship and experience indicate that soil carbon sequestration is harder to achieve than previously thought.94
Changes in plowing practices, such as no-till, which once appeared to avoid soil carbon losses, now appear to provide only small carbon benefits or no benefits when measured at deeper soil depths than previously measured. No-till strategies must also contend with adverse effects on yields on some lands and the fact that many farmers who practice no-till still plow up soils every few years, probably releasing much of any carbon gain.95
Adding mulch or manure are proposed strategies to add carbon to soils but, in effect, double-count their carbon which would have contributed to carbon storage elsewhere. Leaving crop residues otherwise used for animal feed to become soil carbon requires that the animals’ feed comes from other sources, which has some carbon cost because it would often require more agricultural land to grow that feed.
Building soil carbon also generally requires large quantities of nitrogen, which is needed by the microorganisms that convert decaying organic matter to soil organic carbon. Low nitrogen surely limits soil carbon buildup in Africa (Figure 20), where nitrogen additions are insufficient even for crop needs, and probably limits soil carbon buildup elsewhere.96
Scientists have come to realize that they do not well understand the factors that lead carbon to remain stored longer in soils rather than being consumed and returned to the air by microorganisms. There is some evidence that croplands are actually losing soil carbon overall in ways neither we nor other researchers count. For these reasons, we do not include additional soil carbon sequestration as a mitigation strategy. We believe efforts are best directed toward stabilizing soil carbon, that is, avoiding further losses, and focusing on no-regrets strategies that provide additional benefits:
- Avoid conversion of carbon-rich ecosystems (e.g., forests).
- Increase productivity of grasslands and croplands, which adds carbon in roots and residues.
- Increase use of agroforestry, which builds above-ground carbon.
- Pursue efforts to build soil carbon, despite the challenges, in areas where soil fertility is critical for food security.
Figure 20 |
Soils in Africa are relatively low in organic carbon
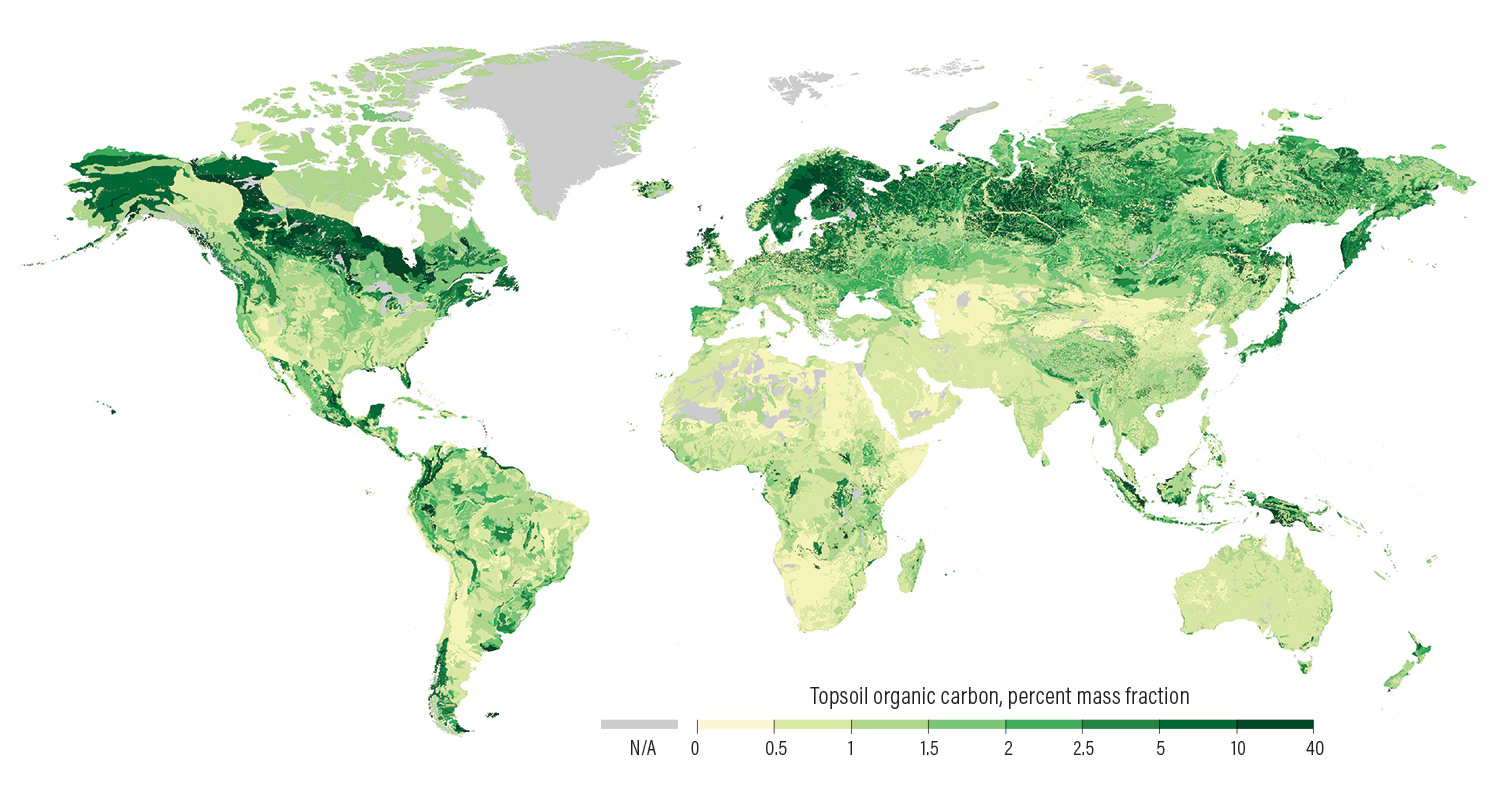
Source
Hengl and Reuter (2009).
Endnotes
- 75Hristov et al. (2014) and Gerber et al. (2013) provide good summaries of the research results to date for all these approaches.
- 76Hristov et al. (2015); Martínez-Fernández et al. (2014); Reynolds et al. (2014); Romero-Perez et al. (2015).
- 77Data on manure management systems are rough but analysis in this paper uses estimates by FAO for the GLEAM model, provided separately but reflected in Gerber et al. (2013) and the I-GLEAM model available at http://www.fao.org/gleam/resources/en/.
- 78Data on manure management systems are rough but analysis in this paper uses estimates by FAO for the GLEAM model, provided separately but reflected in Gerber et al. (2013) and the I-GLEAM model available at http://www.fao.org/gleam/resources/en/.
- 79IPCC (2006), Table 10.17, lists different conversion factors for the percentage of the potentially methane-contributing portions of manure (volatile solids) based on different manure management systems. These percentages depend on temperatures, and the ratios between liquid and dry systems vary modestly because of that, so the ratios described above are those at an average annual temperature of 20 degrees Celsius. The lagoon liquid slurry systems chosen involve a liquid slurry without a natural crust cover, which tends to form in some liquid slurry systems, and which applies both to liquid slurry storage and pit storage below animal confinements.
- 80Authors’ estimate.
- 81USDA/ERS (2015) averages annual prices from 2010 to 2015.
- 82Doole and Paragahawewa (2011).
- 83Byrnes et al. (2017).
- 84Ward et al. (2016); Galbally et al. (2010); Barneze et al. (2014); Mazzetto et al. (2015); Pelster et al. (2016); Sordi et al. (2014).
- 85MarketsAndMarkets (2015) estimated global sales of controlled release fertilizers at $2.2 billion in 2014, out of worldwide nitrogen sales (for 2012) of $99 billion (MarketsAndMarkets [2017]).
- 86Authors’ estimate.
- 87Su et al. (2015).
- 88Jiang et al. (2017).
- 89Joshi et al. (2013).
- 90Itoh et al. (2011).
- 91Saini (2013).
- 92CGIAR Research Program on Roots, Tubers and Bananas (2016).
- 93Goodrich et al. (2012).
- 94See, e.g., Powlson et al. (2016); Powlson et al. (2014); van Groenigen et al. (2017).
- 95Powlson et al. (2014), summarizing studies.
- 96Kirkby et al. (2011).
- 97Padhee (2018).