Course 4: Increase Fish Supply (Synthesis)
{"Glossary":{"51":{"name":"agricultural tree crops","description":"Trees cultivated for their food, cultural, or economic values. These include oil palm, rubber, cocoa, cashew, mango, oranges (citrus), plantain, banana, and coconut.\r\n"},"141":{"name":"agroforestry","description":"A diversified set of agricultural or agropastoral production systems that integrate trees in the agricultural landscape.\r\n"},"101":{"name":"albedo","description":"The ability of surfaces to reflect sunlight.\u0026nbsp;Light-colored surfaces return a large part of the sunrays back to the atmosphere (high albedo). Dark surfaces absorb the rays from the sun (low albedo).\r\n"},"94":{"name":"biodiversity intactness","description":"The proportion and abundance of a location\u0027s original forest community (number of species and individuals) that remain.\u0026nbsp;\r\n"},"95":{"name":"biodiversity significance","description":"The importance of an area for the persistence of forest-dependent species based on range rarity.\r\n"},"142":{"name":"boundary plantings","description":"Trees planted along boundaries or property lines to mark them well.\r\n"},"98":{"name":"carbon dioxide equivalent (CO2e)","description":"Carbon dioxide equivalent (CO2e) is a measure used to aggregate emissions from various greenhouse gases (GHGs) on the basis of their 100-year global warming potentials by equating non-CO2 GHGs to the equivalent amount of CO2.\r\n"},"99":{"name":"CO2e","description":"Carbon dioxide equivalent (CO2e) is a measure used to aggregate emissions from various greenhouse gases (GHGs) on the basis of their 100-year global warming potentials by equating non-CO2 GHGs to the equivalent amount of CO2.\r\n"},"1":{"name":"deforestation","description":"The change from forest to another land cover or land use, such as forest to plantation or forest to urban area.\r\n"},"77":{"name":"deforested","description":"The change from forest to another land cover or land use, such as forest to plantation or forest to urban area.\r\n"},"76":{"name":"degradation","description":"The reduction in a forest\u2019s ability to perform ecosystem services, such as carbon storage and water regulation, due to natural and anthropogenic changes.\r\n"},"75":{"name":"degraded","description":"The reduction in a forest\u2019s ability to perform ecosystem services, such as carbon storage and water regulation, due to natural and anthropogenic changes.\r\n"},"79":{"name":"disturbances","description":"A discrete event that changes the structure of a forest ecosystem.\r\n"},"68":{"name":"disturbed","description":"A discrete event that changes the structure of a forest ecosystem.\r\n"},"65":{"name":"driver of tree cover loss","description":"The direct cause of forest disturbance.\r\n"},"70":{"name":"drivers of loss","description":"The direct cause of forest disturbance.\r\n"},"81":{"name":"drivers of tree cover loss","description":"The direct cause of forest disturbance.\r\n"},"102":{"name":"evapotranspiration","description":"When solar energy hitting a forest converts liquid water into water vapor (carrying energy as latent heat) through evaporation and transpiration.\r\n"},"2":{"name":"forest","description":"Forests include tree cover greater than 30 percent tree canopy density and greater than 5 meters in height as mapped at a 30-meter Landsat pixel scale.\r\n"},"3":{"name":"forest concession","description":"A legal agreement allowing an entity the right to manage a public forest for production purposes.\r\n"},"90":{"name":"forest concessions","description":"A legal agreement allowing an entity the right to manage a public forest for production purposes.\r\n"},"53":{"name":"forest degradation","description":"The reduction in a forest\u2019s ability to perform ecosystem services, such as carbon storage and water regulation, due to natural and anthropogenic changes.\r\n"},"54":{"name":"forest disturbance","description":"A discrete event that changes the structure of a forest ecosystem.\r\n"},"100":{"name":"forest disturbances","description":"A discrete event that changes the structure of a forest ecosystem.\r\n"},"5":{"name":"forest fragmentation","description":"The breaking of large, contiguous forests into smaller pieces, with other land cover types interspersed.\r\n"},"6":{"name":"forest management plan","description":"A plan that documents the stewardship and use of forests and other wooded land to meet environmental, economic, social, and cultural objectives. Such plans are typically implemented by companies in forest concessions.\r\n"},"62":{"name":"forests","description":"Forests include tree cover greater than 30 percent tree canopy density and greater than 5 meters in height as mapped at a 30-meter Landsat pixel scale.\r\n"},"69":{"name":"fragmentation","description":"The breaking of large, contiguous forests into smaller pieces, with other land cover types interspersed.\r\n"},"80":{"name":"fragmented","description":"The breaking of large, contiguous forests into smaller pieces, with other land cover types interspersed.\r\n"},"74":{"name":"gain","description":"The establishment of tree canopy in an area that previously had no tree cover. Tree cover gain may indicate a number of potential activities, including natural forest growth or the crop rotation cycle of tree plantations.\r\n"},"143":{"name":"global land squeeze","description":"Pressure on finite land resources to produce food, feed and fuel for a growing human population while also sustaining biodiversity and providing ecosystem services.\r\n"},"7":{"name":"hectare","description":"One hectare equals 100 square meters, 2.47 acres, or 0.01 square kilometers and is about the size of a rugby field. A football pitch is slightly smaller than a hectare (pitches are between 0.62 and 0.82 hectares).\r\n"},"66":{"name":"hectares","description":"One hectare equals 100 square meters, 2.47 acres, or 0.01 square kilometers and is about the size of a rugby field. A football pitch is slightly smaller than a hectare (pitches are between 0.62 and 0.82 hectares).\r\n"},"67":{"name":"intact","description":"A forest that contains no signs of human activity or habitat fragmentation as determined by remote sensing images and is large enough to maintain all native biological biodiversity.\r\n"},"78":{"name":"intact forest","description":"A forest that contains no signs of human activity or habitat fragmentation as determined by remote sensing images and is large enough to maintain all native biological biodiversity.\r\n"},"8":{"name":"intact forests","description":"A forest that contains no signs of human activity or habitat fragmentation as determined by remote sensing images and is large enough to maintain all native biological biodiversity.\r\n"},"55":{"name":"land and environmental defenders","description":"People who peacefully promote and protect rights related to land and\/or the environment.\r\n"},"9":{"name":"loss driver","description":"The direct cause of forest disturbance.\r\n"},"10":{"name":"low tree canopy density","description":"Less than 30 percent tree canopy density.\r\n"},"84":{"name":"managed forest concession","description":"Areas where governments have given rights to private companies to harvest timber and other wood products from natural forests on public lands.\r\n"},"83":{"name":"managed forest concession maps for nine countries","description":"Cameroon, Canada, Central African Republic, Democratic Republic of the Congo, Equatorial Guinea, Gabon, Indonesia, Liberia, and the Republic of the Congo\r\n"},"104":{"name":"managed natural forests","description":"Naturally regenerated forests with signs of management, including logging, clear cuts, etc.\r\n"},"91":{"name":"megacities","description":"A city with more than 10 million people.\r\n"},"57":{"name":"megacity","description":"A city with more than 10 million people."},"56":{"name":"mosaic restoration","description":"Restoration that integrates trees into mixed-use landscapes, such as agricultural lands and settlements, where trees can support people through improved water quality, increased soil fertility, and other ecosystem services. This type of restoration is more likely in deforested or degraded forest landscapes with moderate population density (10\u2013100 people per square kilometer). "},"86":{"name":"natural","description":"A forest that is grown without human intervention.\r\n"},"12":{"name":"natural forest","description":"A forest that is grown without human intervention.\r\n"},"63":{"name":"natural forests","description":"A forest that is grown without human intervention.\r\n"},"144":{"name":"open canopy systems","description":"Individual tree crowns that do not overlap to form a continuous canopy layer.\r\n"},"82":{"name":"persistent gain","description":"Forests that have experienced one gain event from 2001 to 2016.\r\n"},"13":{"name":"persistent loss and gain","description":"Forests that have experienced one loss or one gain event from 2001 to 2016."},"97":{"name":"plantation","description":"An area in which trees have been planted, generally for commercial purposes.\u0026nbsp;\r\n"},"93":{"name":"plantations","description":"An area in which trees have been planted, generally for commercial purposes.\u0026nbsp;\r\n"},"88":{"name":"planted","description":"A forest composed of trees that have been deliberately planted and\/or seeded by humans.\r\n"},"14":{"name":"planted forest","description":"Stand of planted trees \u2014 other than tree crops \u2014 grown for wood and wood fiber production or for ecosystem protection against wind and\/or soil erosion.\r\n"},"73":{"name":"planted forests","description":"Stand of planted trees \u2014 other than tree crops \u2014 grown for wood and wood fiber production or for ecosystem protection against wind and\/or soil erosion."},"148":{"name":"planted trees","description":"Stand of trees established through planting, including both planted forest and tree crops."},"149":{"name":"Planted trees","description":"Stand of trees established through planting, including both planted forest and tree crops."},"15":{"name":"primary forest","description":"Old-growth forests that are typically high in carbon stock and rich in biodiversity. The GFR uses a humid tropical primary rainforest data set, representing forests in the humid tropics that have not been cleared in recent years.\r\n"},"64":{"name":"primary forests","description":"Old-growth forests that are typically high in carbon stock and rich in biodiversity. The GFR uses a humid tropical primary rainforest data set, representing forests in the humid tropics that have not been cleared in recent years.\r\n"},"58":{"name":"production forest","description":"A forest where the primary management objective is to produce timber, pulp, fuelwood, and\/or nonwood forest products."},"89":{"name":"production forests","description":"A forest where the primary management objective is to produce timber, pulp, fuelwood, and\/or nonwood forest products.\r\n"},"87":{"name":"seminatural","description":"A managed forest modified by humans, which can have a different species composition from surrounding natural forests.\r\n"},"59":{"name":"seminatural forests","description":"A managed forest modified by humans, which can have a different species composition from surrounding natural forests. "},"96":{"name":"shifting agriculture","description":"Temporary loss or permanent deforestation due to small- and medium-scale agriculture.\r\n"},"103":{"name":"surface roughness","description":"Surface roughness of forests creates\u0026nbsp;turbulence that slows near-surface winds and cools the land as it lifts heat from low-albedo leaves and moisture from evapotranspiration high into the atmosphere and slows otherwise-drying winds. \r\n"},"17":{"name":"tree cover","description":"All vegetation greater than five meters in height and may take the form of natural forests or plantations across a range of canopy densities. Unless otherwise specified, the GFR uses greater than 30 percent tree canopy density for calculations.\r\n"},"71":{"name":"tree cover canopy density is low","description":"Less than 30 percent tree canopy density.\r\n"},"60":{"name":"tree cover gain","description":"The establishment of tree canopy in an area that previously had no tree cover. Tree cover gain may indicate a number of potential activities, including natural forest growth or the crop rotation cycle of tree plantations.\u0026nbsp;As such, tree cover gain does not equate to restoration.\r\n"},"18":{"name":"tree cover loss","description":"The removal or mortality of tree cover, which can be due to a variety of factors, including mechanical harvesting, fire, disease, or storm damage. As such, loss does not equate to deforestation.\r\n"},"150":{"name":"tree crops","description":"Stand of perennial trees that produce agricultural products, such as rubber, oil palm, coffee, coconut, cocoa and orchards."},"19":{"name":"tree plantation","description":"An agricultural plantation of fast-growing tree species on short rotations for the production of timber, pulp, or fruit.\r\n"},"72":{"name":"tree plantations","description":"An agricultural plantation of fast-growing tree species on short rotations for the production of timber, pulp, or fruit.\r\n"},"85":{"name":"trees outside forests","description":"Trees found in urban areas, alongside roads, or within agricultural land\u0026nbsp;are often referred to as Trees Outside Forests (TOF).\u202f\r\n"},"151":{"name":"unmanaged","description":"Naturally regenerated forests without any signs of management, including primary forest."},"105":{"name":"unmanaged natural forests","description":"Naturally regenerated forests without any signs of management, including primary forest.\r\n"}}}
Course 4
Increase Fish Supply (Synthesis)
Fish, including finfish and shellfish, provide only small percentages of total global calories and protein, but they contribute 17 percent of animal-based protein,69 and are particularly important for more than 3 billion people in developing countries.70 We project fish consumption to rise 58 percent between 2010 and 2050, but the wild fish catch peaked at 94 million tons in the mid-1990s and has since stagnated or perhaps declined.71 This course proposes ways to improve wild fisheries management and raise the productivity and environmental performance of aquaculture.
-
According to FAO, 33 percent of marine stocks were overfished in 2015, with another 60 percent fished at maximum sustainable levels (Figure 15). One World Bank study found that world fishing effort needs to decline by 5 percent per year over a 10-year period just to allow fish stocks to rebuild.72
Solutions to curb overfishing are well-known and documented. They focus on principles including limiting catches to a level that allows the fish population to reproduce, limiting the number of fishers to an economically sustainable level, protecting habitat, and avoiding harvest during important breeding times or in important breeding areas.
The challenges to implementing these solutions are largely political and social. Wild fish are a public resource that individual fishers have incentives to exploit before others can do so. Other challenges reflect power imbalances, where foreign fleets from richer countries often are able to obtain agreements to fish in the waters of poorer countries with weaker laws and enforcement capacity. Solutions require mechanisms for persuading fishers to support reductions in fish catch levels:
- Catch shares limit total fish catch and allocate shares of the catch among fishers, who then have a long-term interest in preserving the health of the fishery.
- Where oversight is weaker, community-based comanagement systems may prove more effective. Such systems combine territorial fishing rights and no-take reserves designed and supported by coastal fishing communities.
- Removing perverse subsidies—estimated at $35 billion annually73—could dramatically reduce overfishing.
Because reducing overfishing is hard, we assume a 10 percent reduction in wild fish catch between 2010 and 2050 in our baseline scenario, and even that goal requires major reforms. A scenario in which fisheries are rebuilt enough to maintain the 2010 level of fish catch in 2050 would have little effect on our gaps but would supply an additional 9 Mt of fish (relative to our 2050 baseline) and would avoid the need to convert 5 Mha of land to supply the equivalent amount of fish from aquaculture ponds.
Figure 15 |
The percentage of overfished stocks has risen over the past 40 years

Source
FAO (2018).
-
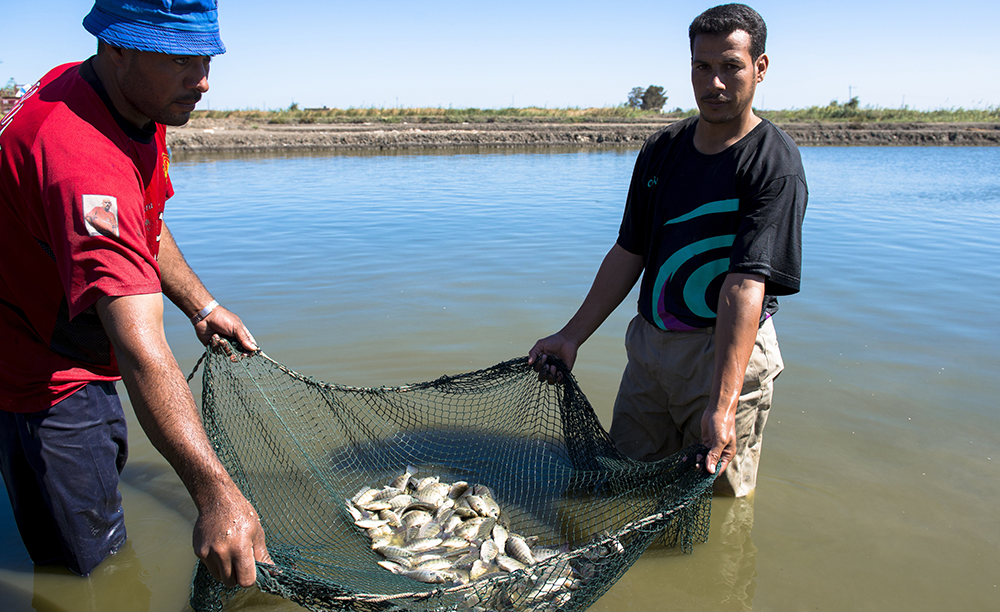
Growth in world fish supply since the 1990s has come from aquaculture (fish farming). Aquaculture production would need to more than double between 2010 and 2050 to meet projected fish demand in our baseline (Figure 16).
Aquaculture is a relatively efficient means of supplying animal-based protein. Although efficiencies vary by type of fish and production method, average land-use demands are on par with poultry production (Figure 5) and can even be zero for certain species (e.g., bivalve mollusks). Greenhouse gas emissions from aquaculture are similar to those of poultry and pork production, and much less than those of ruminant meats.
Yet aquaculture presents a range of environmental challenges, which vary by production system. They include conversion of valuable wetland habitats (such as mangroves), use of wild-caught fish in feeds, high freshwater demand, water pollution, and effects of escaped farm fish on wild fish. Aquaculture ponds occupied an estimated 19 Mha in 2010, while an additional 27 Mha was used to grow crop-based fish feed. The total land-use demands roughly double in our 2050 baseline projection.
Aquaculture must become more land-efficient, especially because available land is constrained in Asia, where nearly 90 percent of aquaculture production occurs.74 Shifting to deeper ponds with water recirculation will be necessary to increase production while limiting land expansion. Opportunities also exist to expand aquaculture in marine waters, possibly further offshore.
Aquaculture growth will require development of feed substitutes to replace oil from wild fish because this source is already near or above ecological limits. Promising alternatives include microalgae-based feeds and uses of genetically engineered yeasts or oilseeds bred to produce the omega-3 fatty acids that characterize wild fish oil. Aquaculture must also overcome significant rates of fish disease.
Several strategies can help aquaculture grow sustainably to help meet rising fish demand:
- Selective breeding for improved fish growth rates and conversion efficiencies.
- Technological developments in fish oil alternatives, other feed improvements, and disease control.
- Use of water recirculation and other pollution controls.
- Use of spatial planning to optimize aquaculture siting.
- Expansion of marine-based systems.
Figure 16 |
Aquaculture production must continue to grow to meet world fish demand

Source
Historical data, 1950–2016: FAO (2017b) and FAO (2018). Projections to 2050: Calculated at WRI; assumes 10 percent reduction in wild fish catch from 2010 levels by 2050, linear growth of aquaculture production of 2 Mt per year between 2010 and 2050.
Endnotes
- 69FAO (2017a).
- 70In 2013–15, fish provided about 3.2 billion people with 20% of their animal protein intake (FAO 2018).
- 71FAO (2017b).
- 72World Bank (2017b).
- 73Sumaila et al. (2010); Sumaila et al. (2012); Sumaila and Rachid (2016).
- 74FAO (2017b).